Google Analytics offers a treasure trove of data. But for beginners, it can seem overwhelming.
Where do you start? What metrics actually matter?
In this post, we'll cover the 12 most important metrics in Google Analytics. These provide the clearest picture of your website's performance.
We’ll explain what each metric means, why it's useful to track, and how to analyze it.
But before we do that, let’s make sure we understand what metrics actually are.
What Are Metrics in Google Analytics 4?
In Google Analytics 4 (GA4), metrics are the quantitative aspects of your data that help you understand and track the performance of your website.
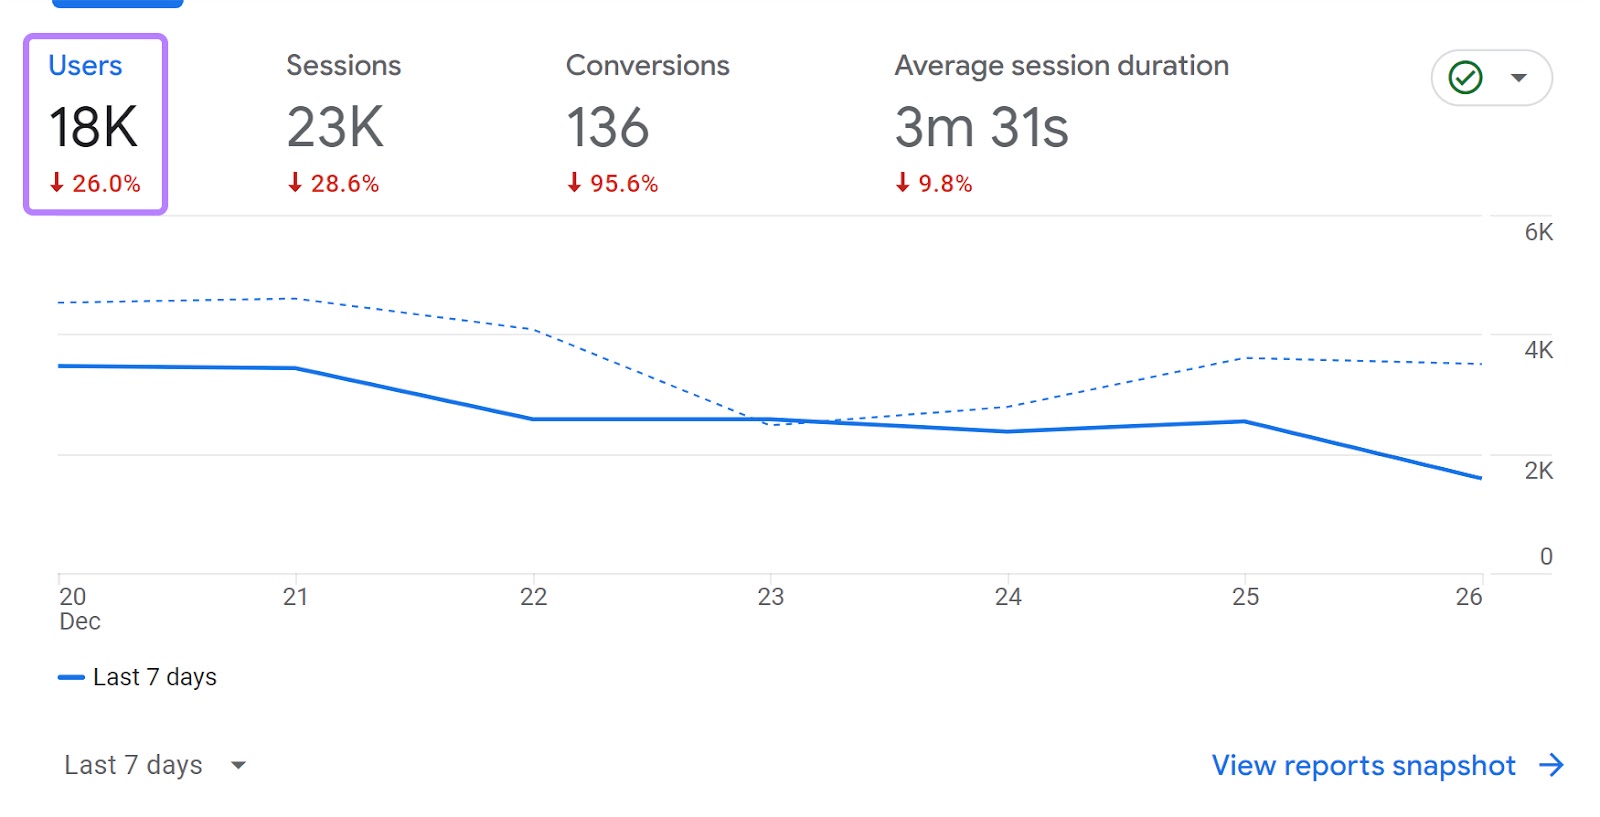
For example, the metric “Users” shows you how many users visited your website over a given time period.
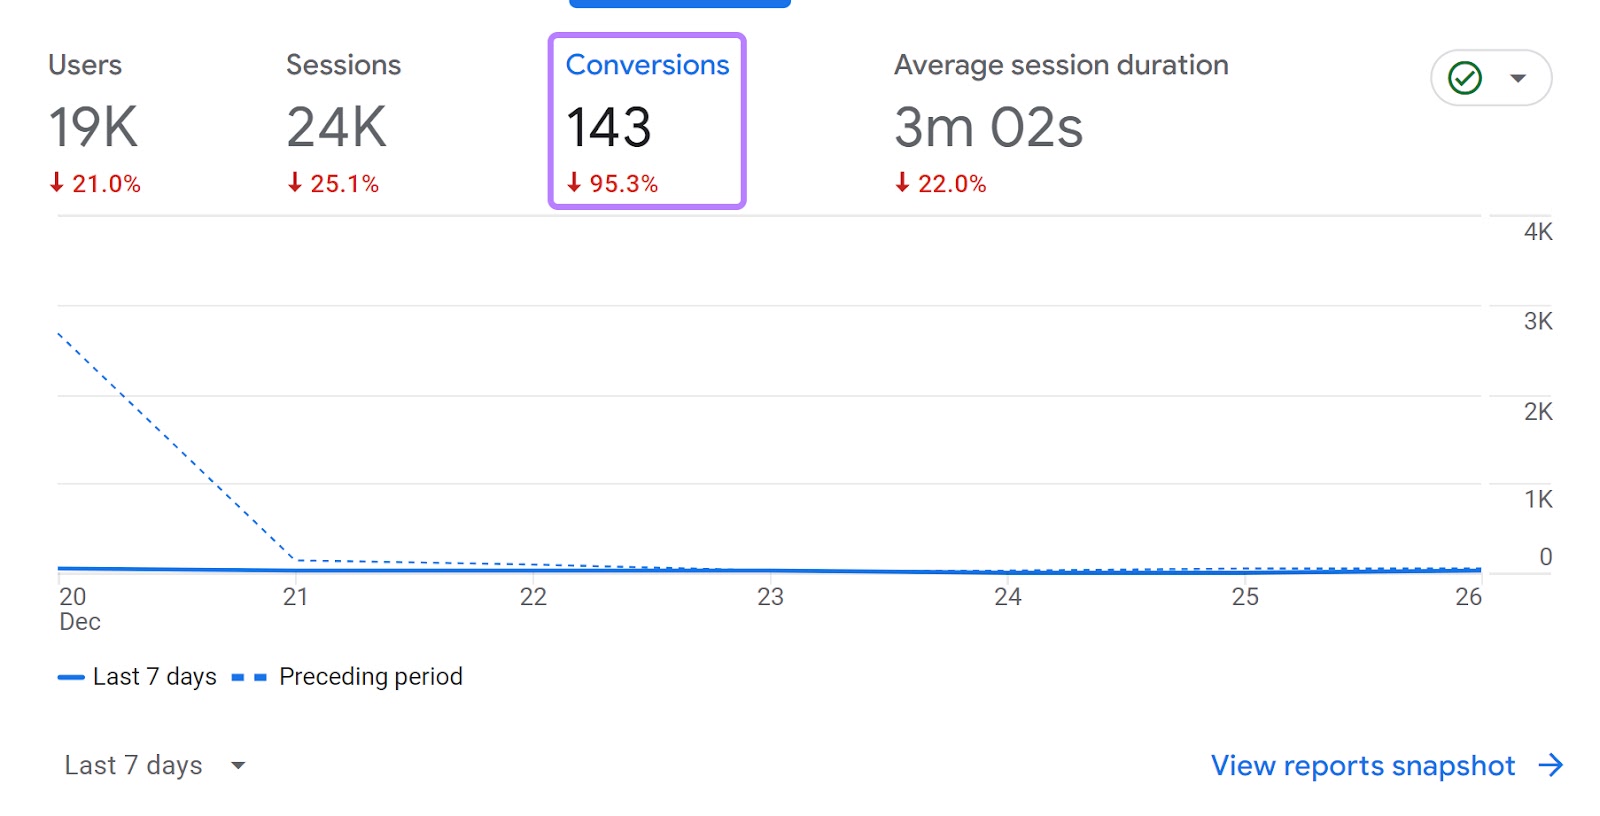
And the metric “Conversions” tells you how many desired actions visitors have completed, like purchases, signups, downloads, etc.
There are plenty of other important Google Analytics metrics. Such as:
- Sessions
- Bounce rate
- New users
- Average engagement time
- Session conversion rate
We’ll cover all these metrics later in this guide. But metrics aren’t the only important measure in Google Analytics 4. You also need to understand dimensions.
Metrics—along with dimensions—are the key building blocks of your analytics reports.
Here’s how metrics and dimensions differ:
Metrics vs. Dimensions in Google Analytics 4
Metrics are quantitative measurements. They represent the “how much” or “how many” in your data using a numerical value.
Dimensions, on the other hand, are non-numeric attributes. They describe the who, what, where, when, and why behind the metrics.
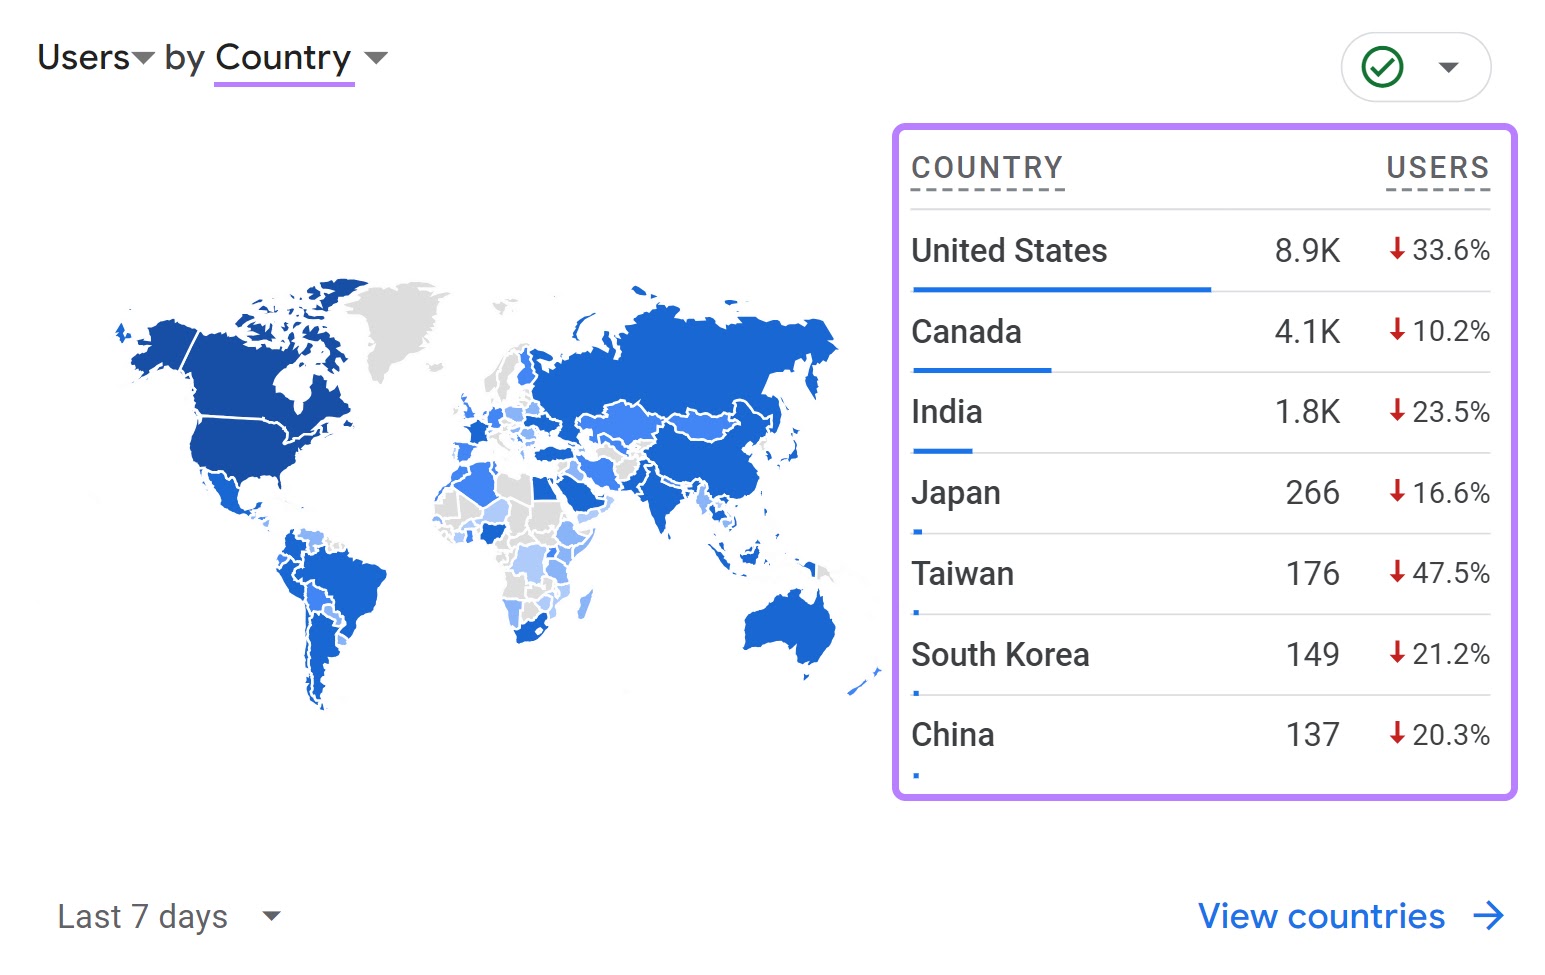
Going back to an earlier example, the “Users” metric tells you exactly how many people visited your site.
And the dimension “Country” contextualizes that number by telling you where those users are located.
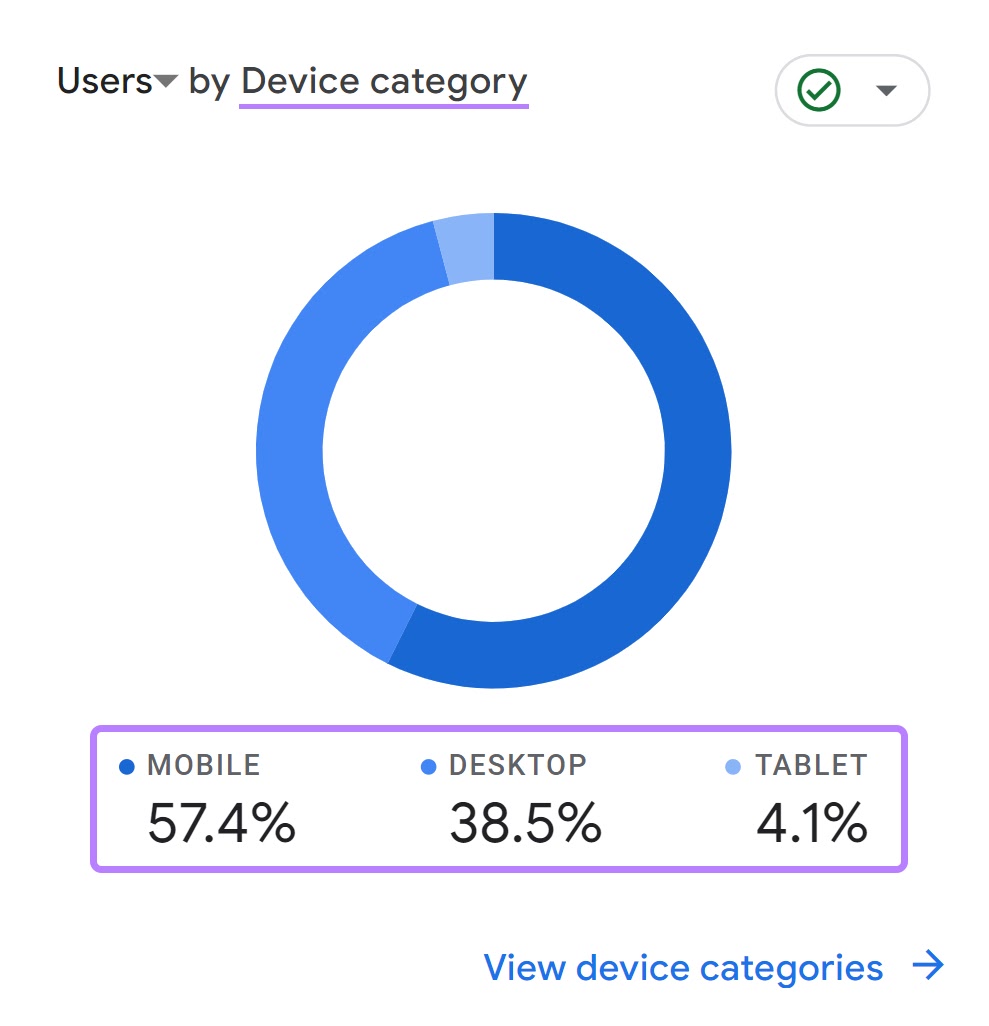
The dimension “Device Category” tells you which devices users browse your website on.
Together, metrics and dimensions give you a comprehensive chart to measure and understand a website's performance.
Further reading: Dimensions in Google Analytics 4
12 Important Metrics in Google Analytics 4
1. Users
The “Users” metric represents the number of people who visited your website during a selected time frame.
This metric is super helpful for understanding the size of your audience and tracking growth over time.
More users = a larger reach.
To see how many users you got, go to “Reports” > “Life cycle” > “Acquisition” > “Overview.”
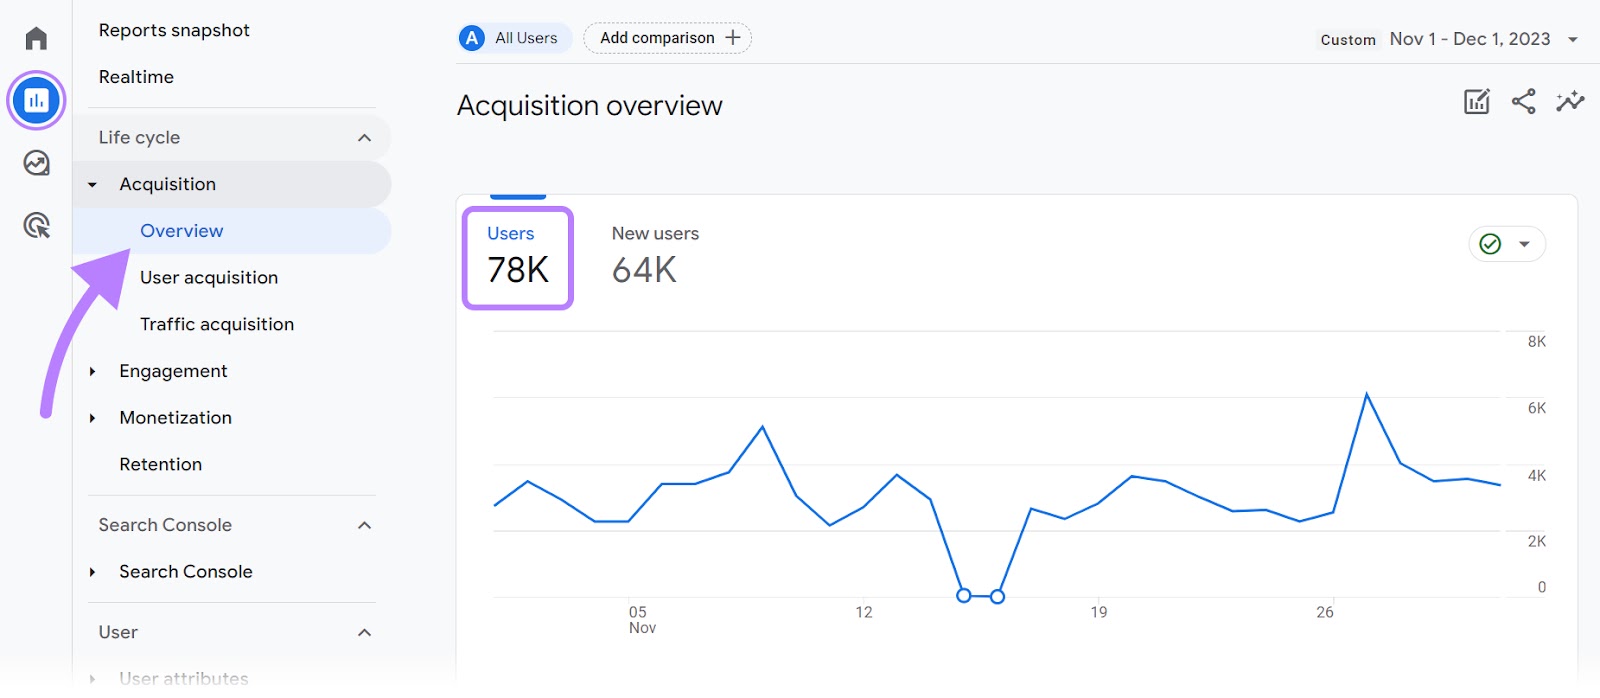
View the overall trend to see if you're attracting more users over time. This indicates growth.
If you aren't seeing an increase in users, that means you need to revisit your marketing strategy.
Read our full guide on how to create effective marketing strategies and get started.
2. Sessions
The “Sessions” metric shows the number of individual browsing sessions that occurred on your site during the selected time period.
Sessions are initiated when a user enters your site. And end after 30 minutes of inactivity or when a user leaves.
A single session can encompass multiple activities, such as viewing one or more pages, clicking on links or buttons, or making purchases.
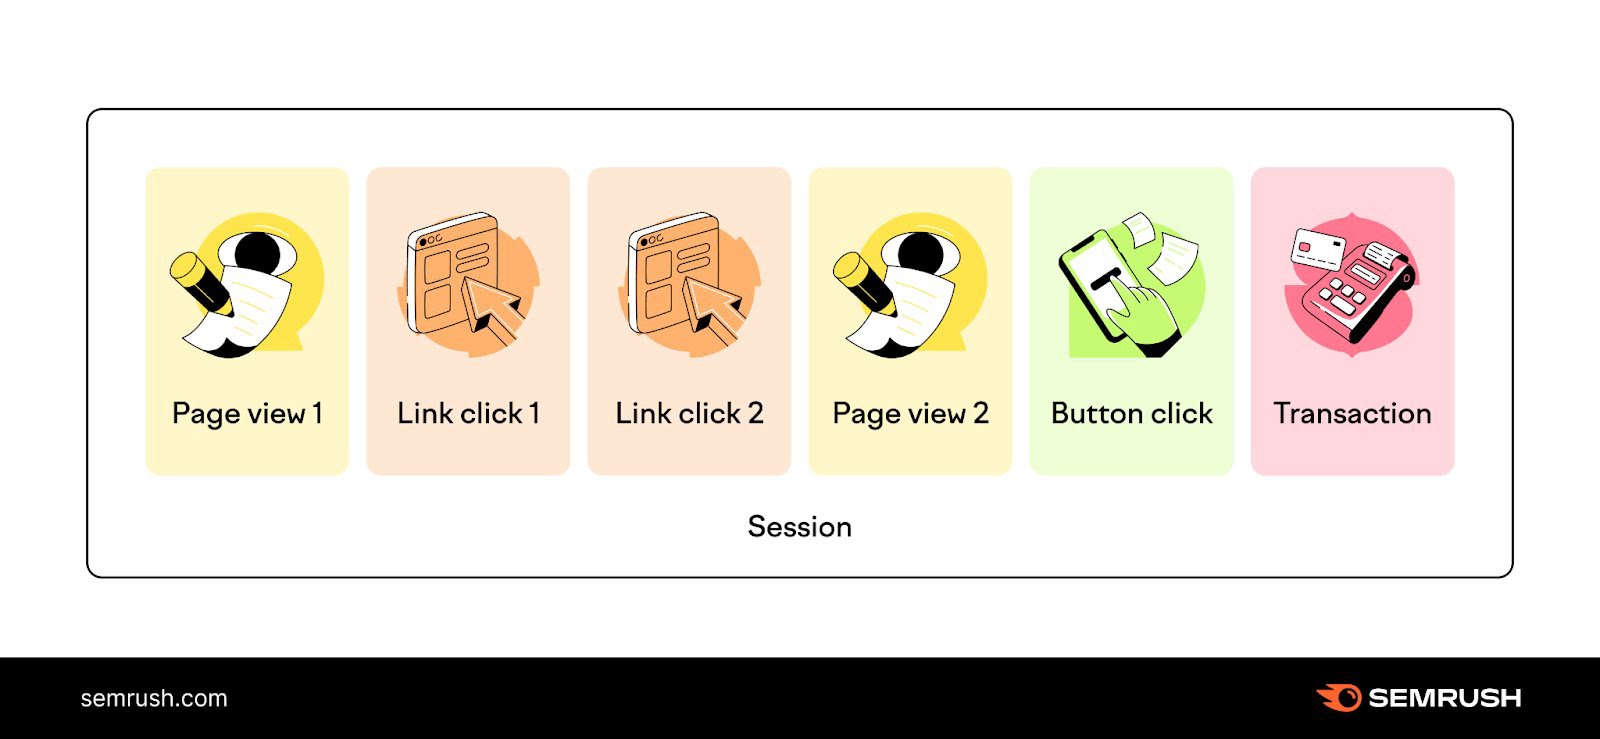
Tracking the “Sessions” metric helps you understand engagement beyond just visitors. High sessions mean people are interested in your content, products, or services.
To find your “Sessions” metric, navigate to “Reports” > “Life cycle” > “Acquisition” > “Traffic acquisition.”
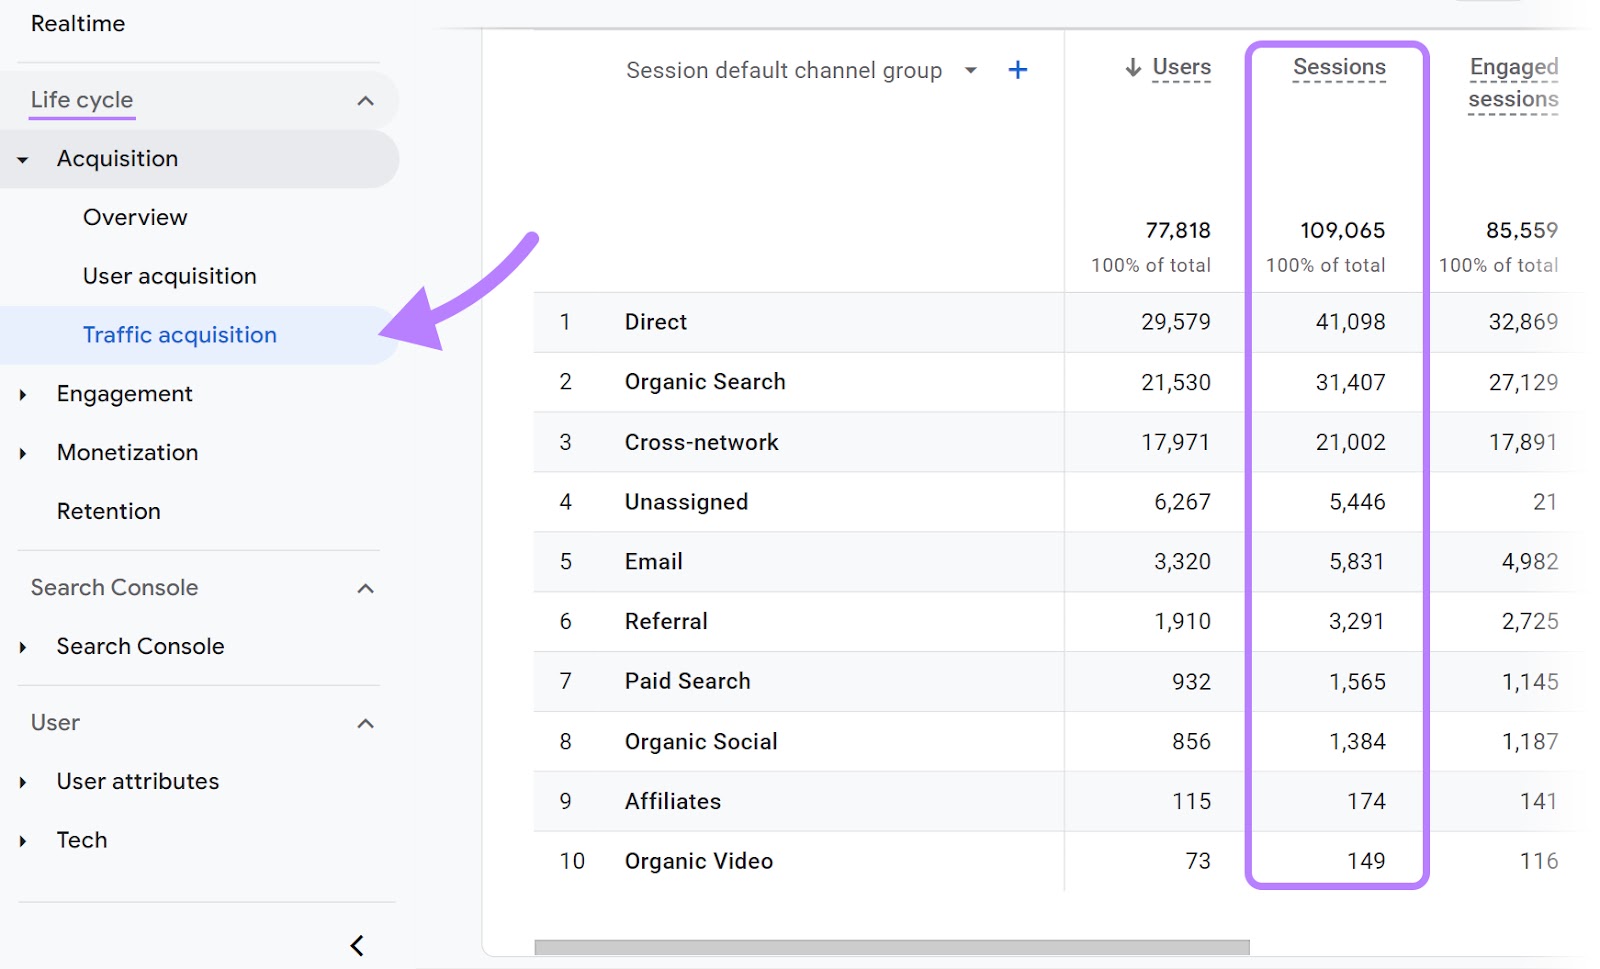
Here, you can see the total number of sessions and how they are distributed across multiple traffic sources.
Identify your top traffic sources driving sessions. And double down on your efforts for them.
If it’s “Organic Search,” step up your search engine optimization (SEO) game.
If it’s “Email,” enhance your email marketing campaigns.
3. New Users
The “New Users” metric shows the number of first-time users who visited your site during the selected time period.
Tracking new users tells you how effective your marketing efforts are at reaching new audiences.
More new users = your marketing and content are attracting a fresh audience.
To check your new users, go to “Reports” > “Life cycle” > “Acquisition” > “Acquisition overview.”

View the overall trend to look for patterns, such as spikes or declines. These can indicate the impact of your marketing efforts.
For instance, a sudden increase in new users could be the result of a viral social media post or a successful advertising campaign.
On the other hand, a decline might suggest that your recent marketing activities are not effectively engaging potential customers.
Once again, consider revisiting your strategy for better results.
4. Average Engagement Time
The “Average engagement time” metric shows how long, on average, users actively engage with your site.
For example, if a user opens your website and spends five minutes reading an article, then this time is counted toward their "Average engagement time." As your website is in focus and the user is actively engaged.
However, if the user opens a new tab and starts browsing another site while your site remains open in the background, this time is not counted. Because your website is no longer the primary focus in the browser.
In other words, “Average engagement time” is calculated based on how long your website was in focus in the user’s browser.
This metric is particularly useful for understanding the quality of user engagement.
To see the “Average engagement time” metric for your site, go to “Reports” > “Life cycle” > “Engagement” > “Overview.”
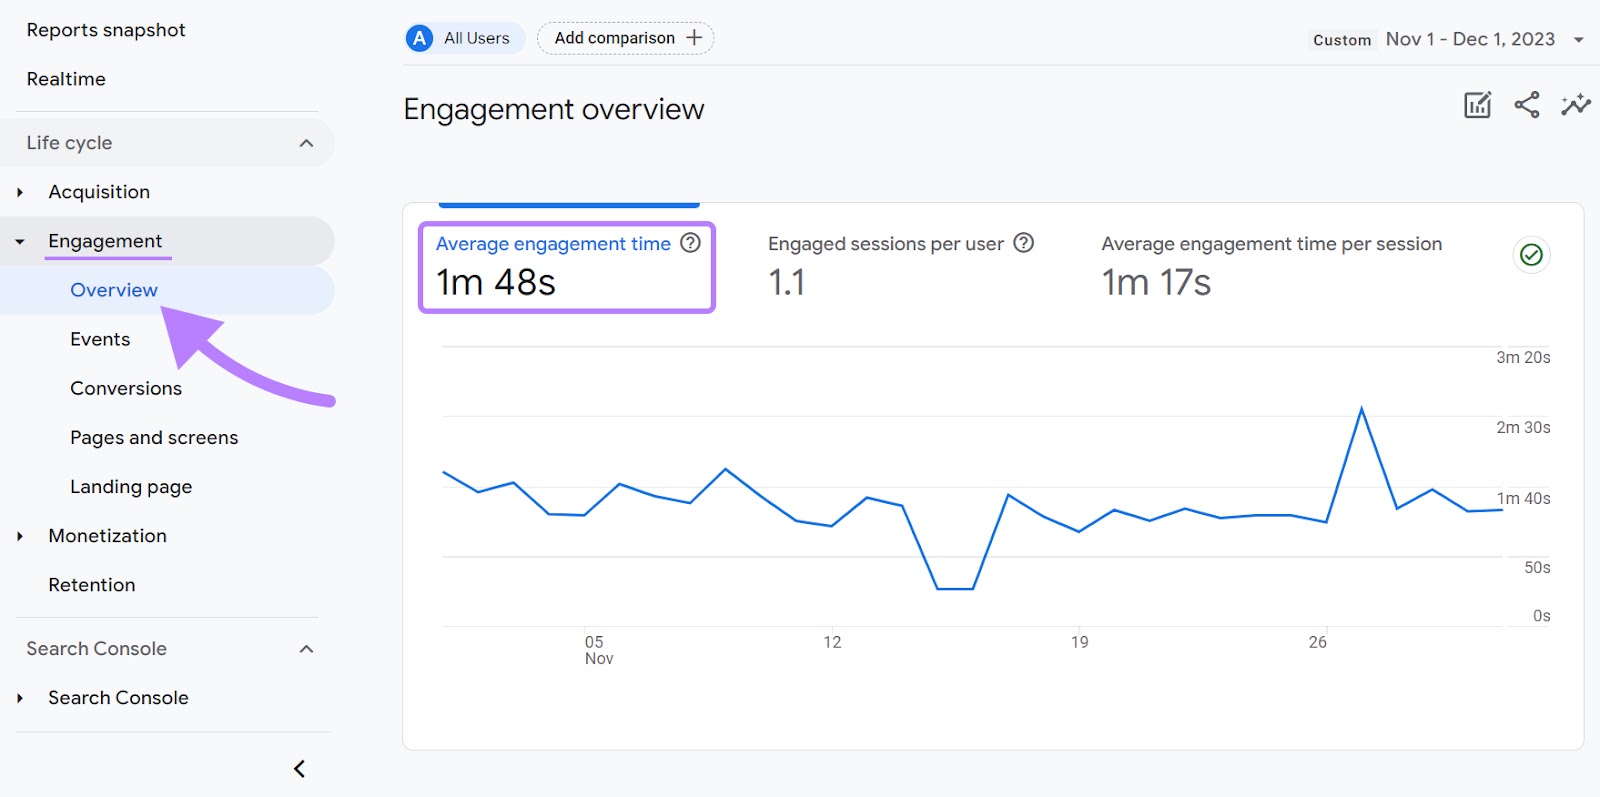
High average engagement times typically indicate that users find your content compelling and relevant, keeping them actively involved with your site.
Conversely, lower average engagement times suggest that you might need to improve your content and/or website usability.
Here are some tips for that:
- Ensure your website is easy to navigate and loads quickly
- Optimize content for readability. Use scannable formatting like bullet points, subheads, short paragraphs, etc. This ensures users continue to read and engage with your content.
- Use visual assets like images, infographics, and videos. This helps to retain user attention.
5. Bounce Rate
The “Bounce rate” is the percentage of non-engaged sessions.
A non-engaged session is one where a user leaves your website in less than 10 seconds. Without triggering any event (like filling out a form) or clicking through to other pages.
For example, if a visitor lands on your homepage and exits within 10 seconds without clicking on any links, or completing actions like filling out a form, or making a purchase, this session is classified as a non-engaged session.
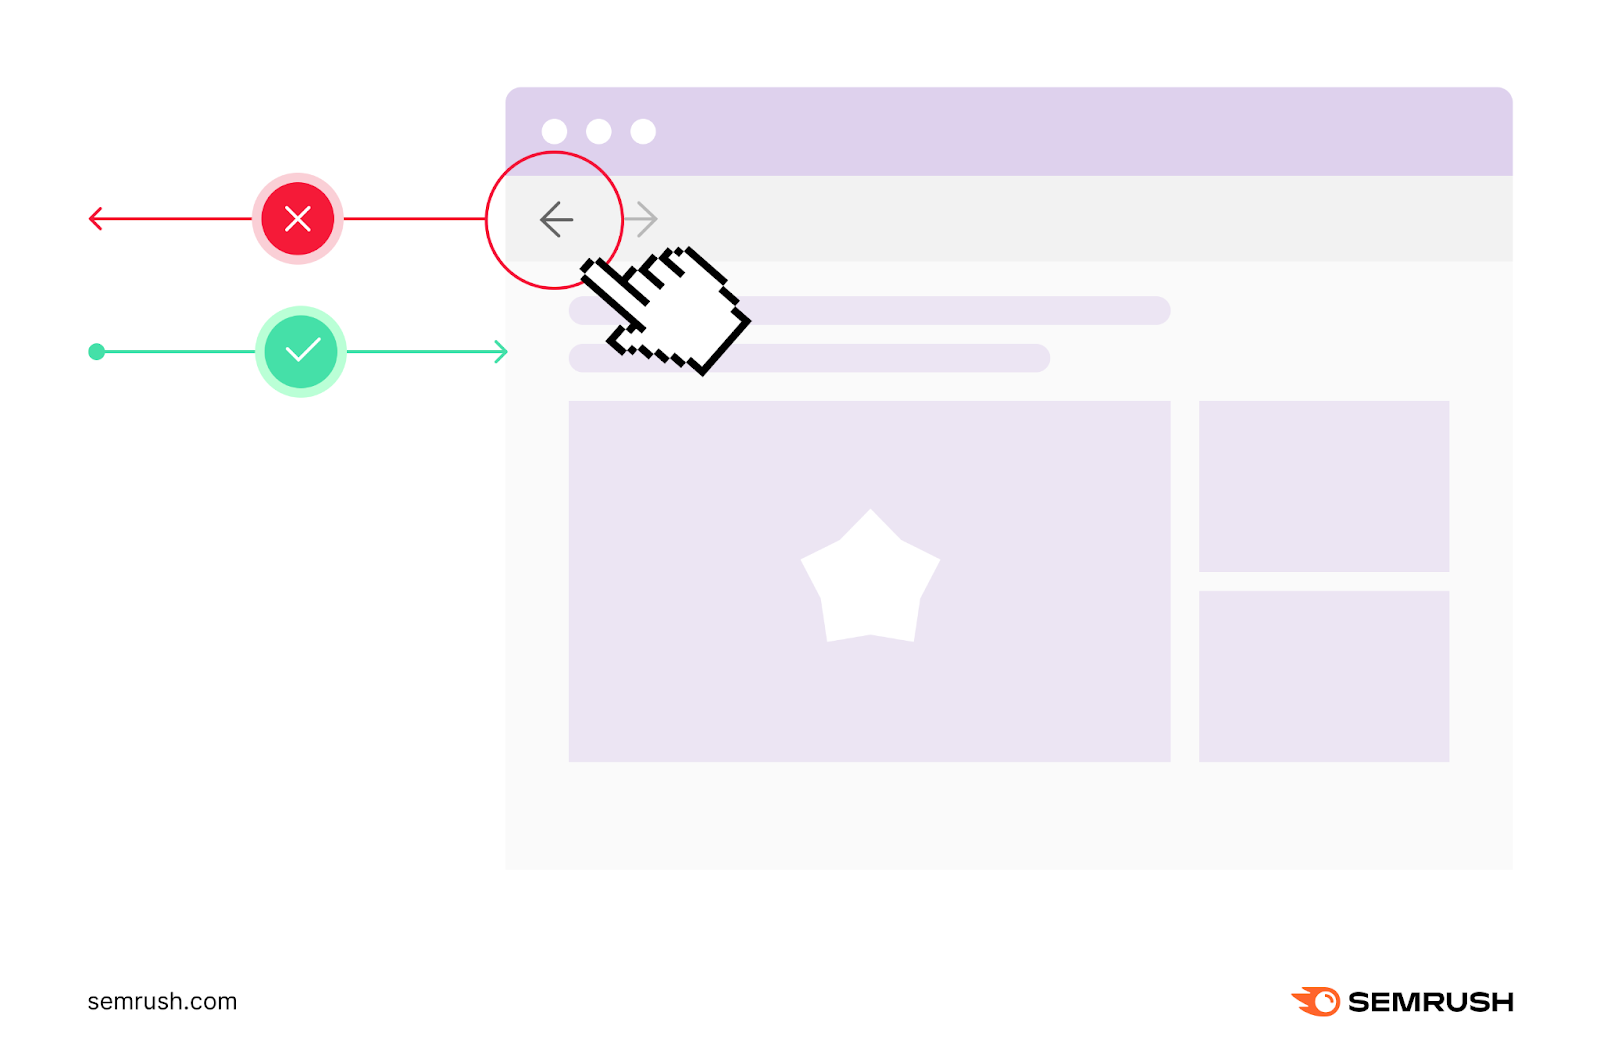
And the “Bounce rate” metric will count this instance toward its calculation.
A high bounce rate often indicates that the webpage is not effectively capturing the interest of visitors.
This could be due to various factors like unappealing web design, unclear messaging, slow page loading times, or content that doesn't match the user's intent.
Conversely, a lower bounce rate suggests users are finding what they are looking for and are encouraged to engage further with your website. By reading more content, viewing products, or performing other meaningful actions.
To see your bounce rate in GA4, you’ll need to customize your “Pages and screens” report.
Go to “Reports” > “Life cycle” > “Engagement” > “Pages and screens.”
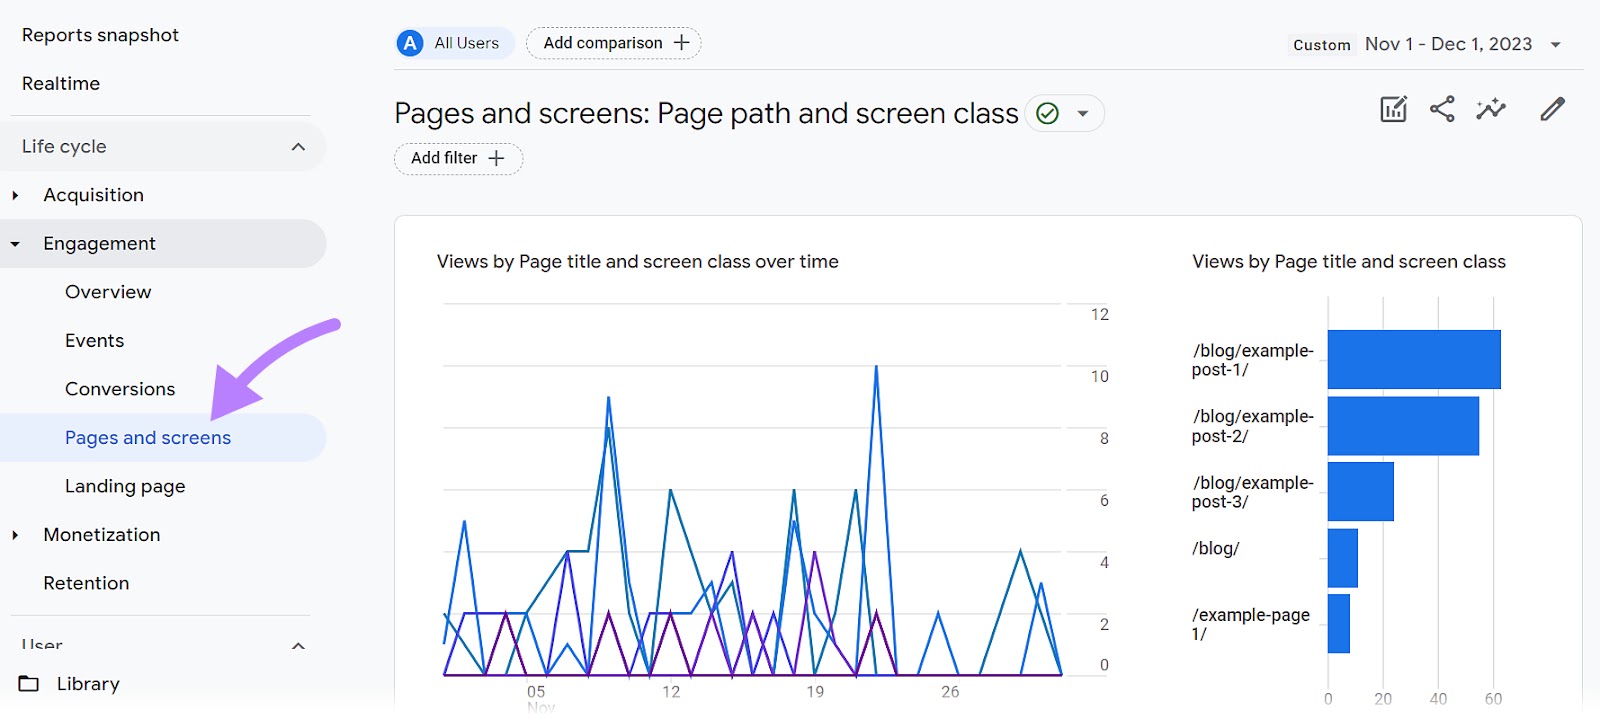
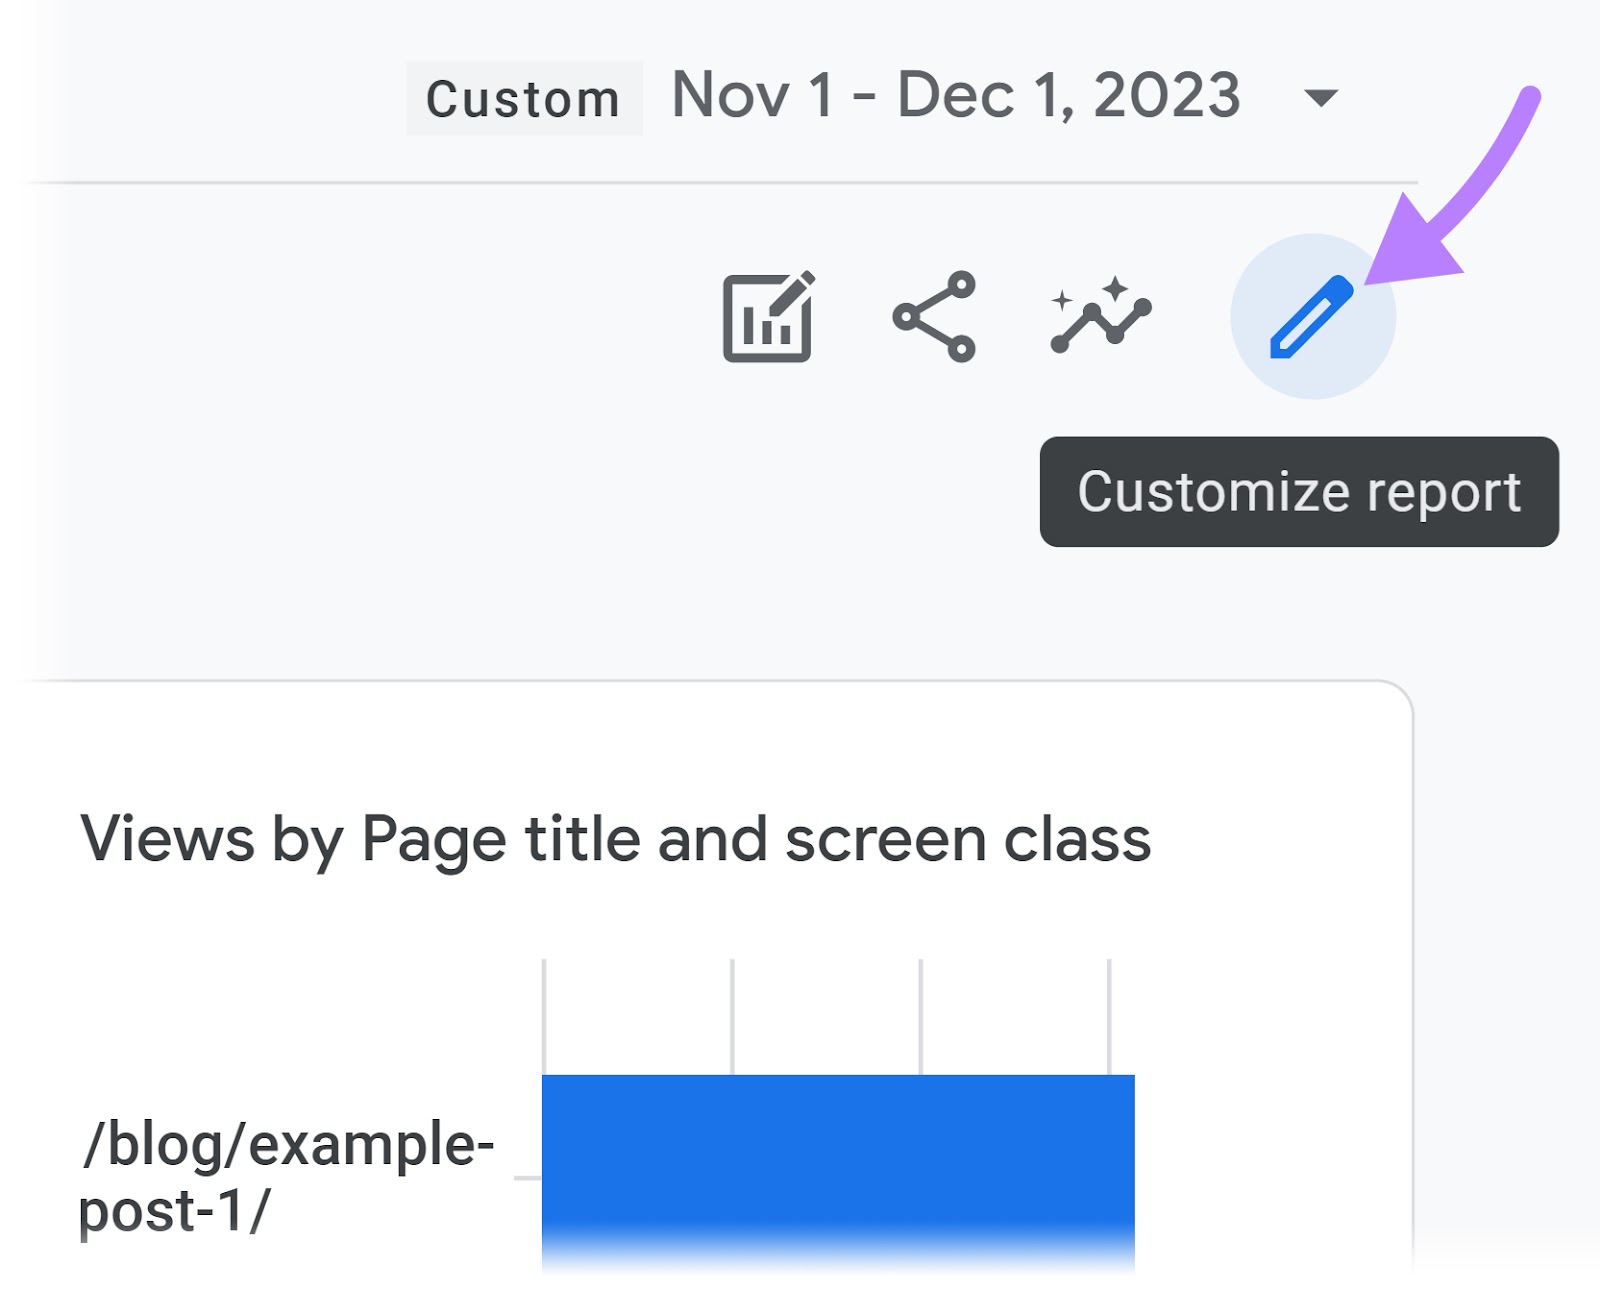
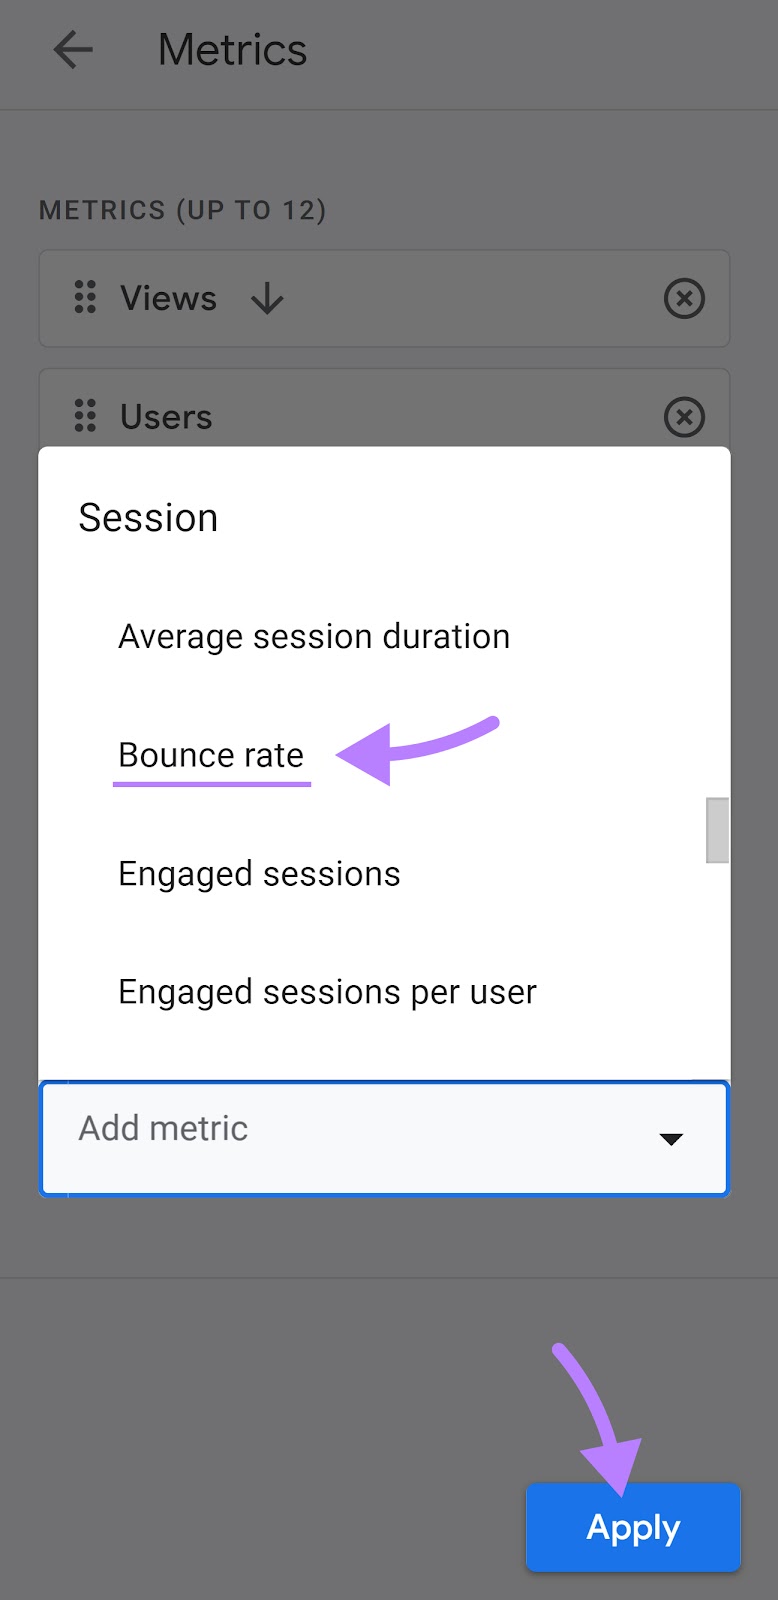
In the top right of your screen, click the pencil icon to customize your report.
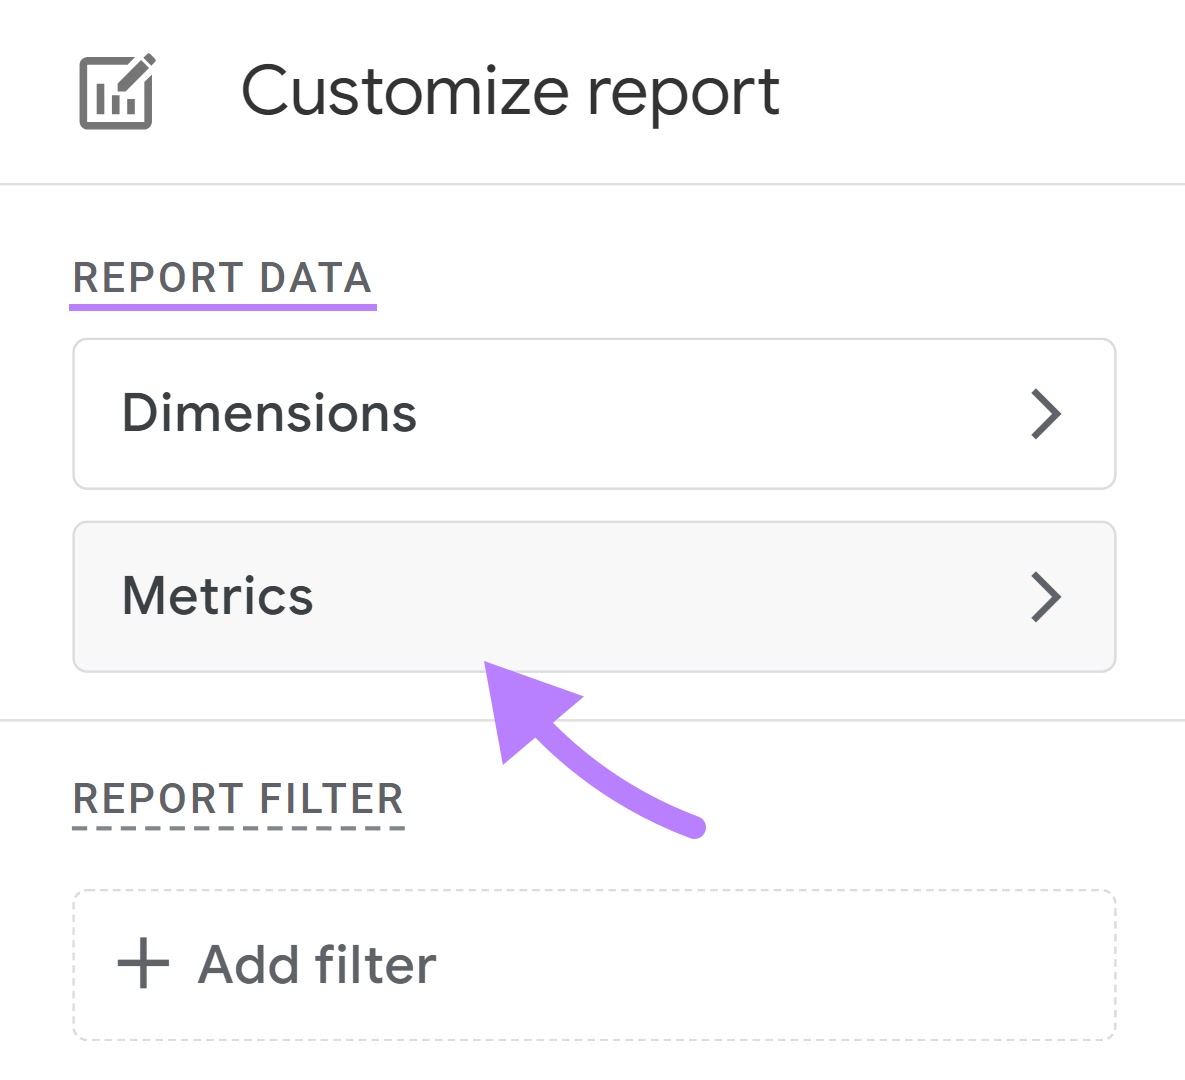
Choose “Metrics” from the “Report Data” section.
From the “Add metric” drop-down, choose “Bounce rate.” And “Apply.”
You should now see the bounce rate in your “Pages and screens” report.
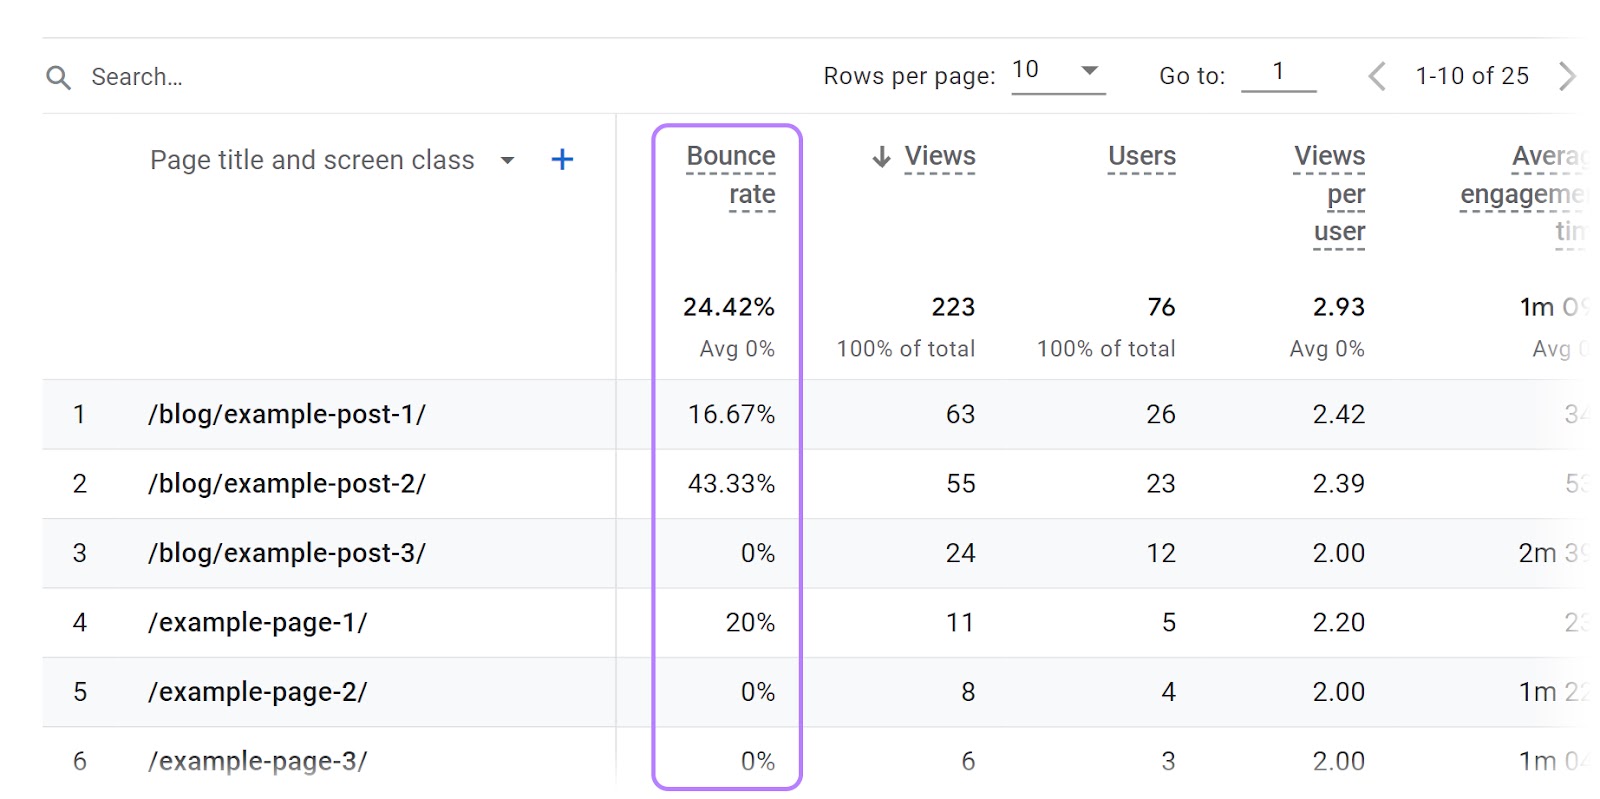
Now, filter by high bounce rate pages.

These are pages that may need optimization.
First, review your page design and messaging. Is it appealing? Does it clearly communicate what the page is about?
Secondly, check the load time. (You can use Google’s PageSpeed Insights tool for that.)
High load time increases the probability of users quitting your site. If you need help, read our full guide on how to improve your page speed.
And last but not least, check if your content aligns with your audience’s needs.
High-quality, relevant content is crucial for keeping users engaged.
6. Session Conversion Rate
The “Session conversion rate” metric represents the percentage of sessions that resulted in a conversion.
A conversion can be any predefined action that is valuable to your business. Such as making a purchase, signing up for a newsletter, filling out a contact form, or downloading a resource.
The formula for calculating it is:
Session conversion rate = (Number of conversions / Number of sessions) * 100
This metric helps in assessing the effectiveness of your marketing campaigns in driving conversions.
To track the “Session conversion rate” in GA4, you’ll first need to create events.
Events let you measure user interactions (like loading a page, clicking a link, or making a purchase).
So for every action you want to measure the conversion rate for, you’ll create an event.
After creating events, you can now find your “Session conversion rate.”
Go to “Reports” > “Life cycle” > “Acquisition” > “Traffic acquisition.”

Then, find the pencil icon in the upper right corner.
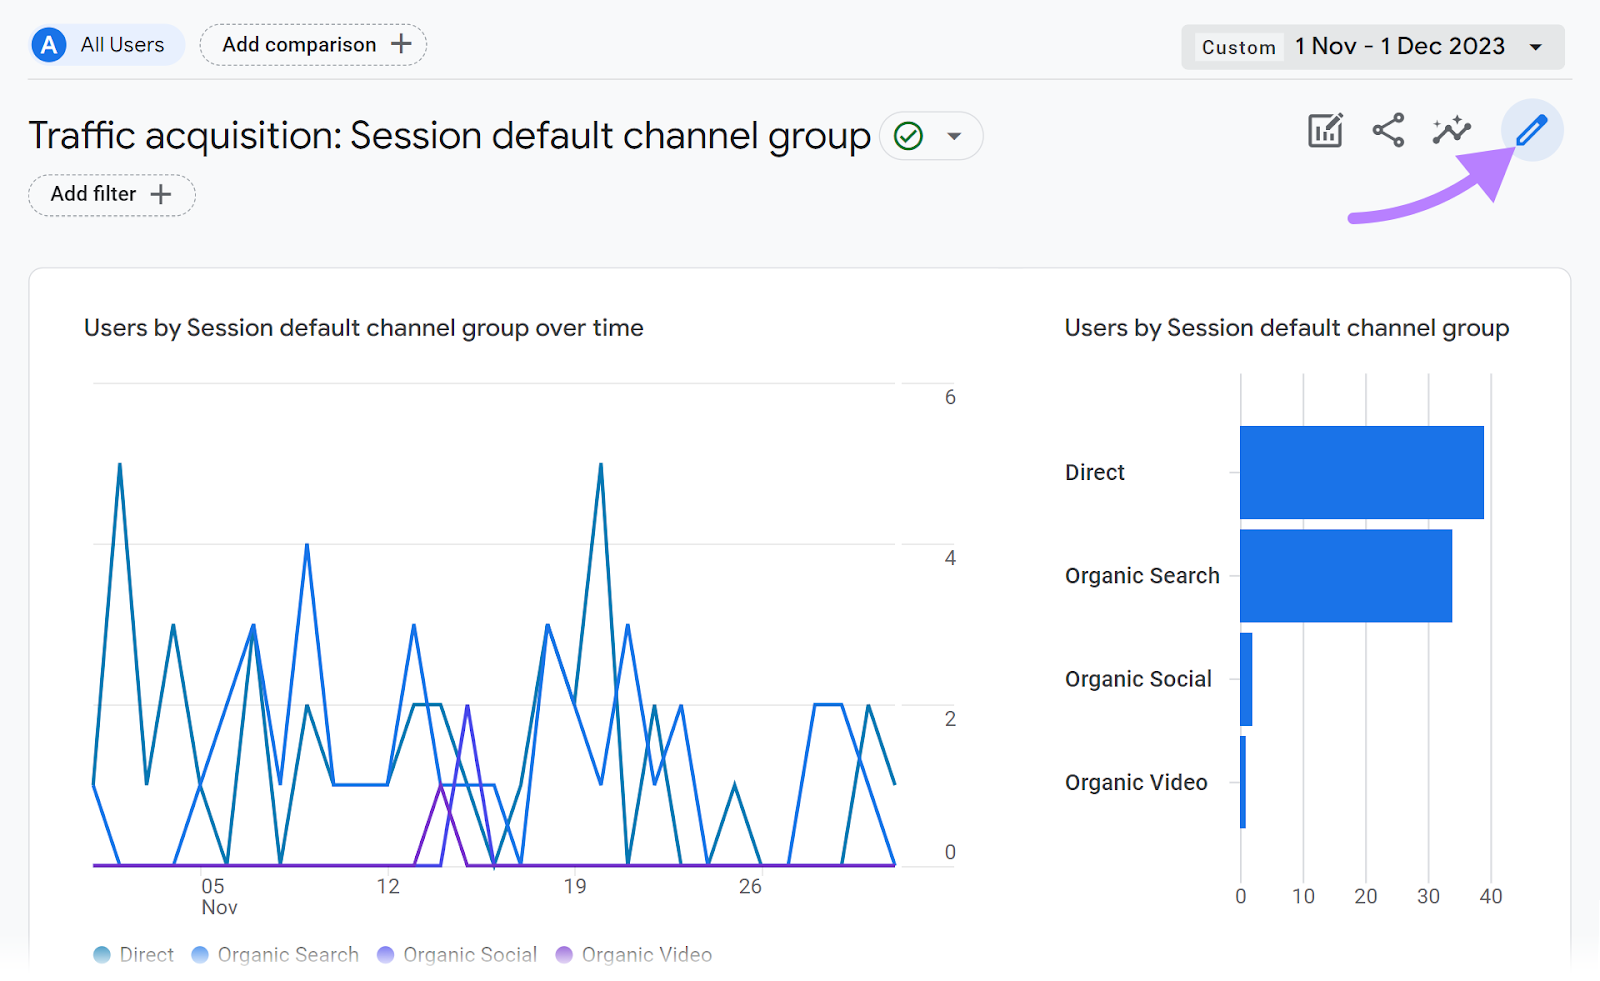
Find “Metrics.”

Then, “Add metric.” And look for “Session conversion rate.”
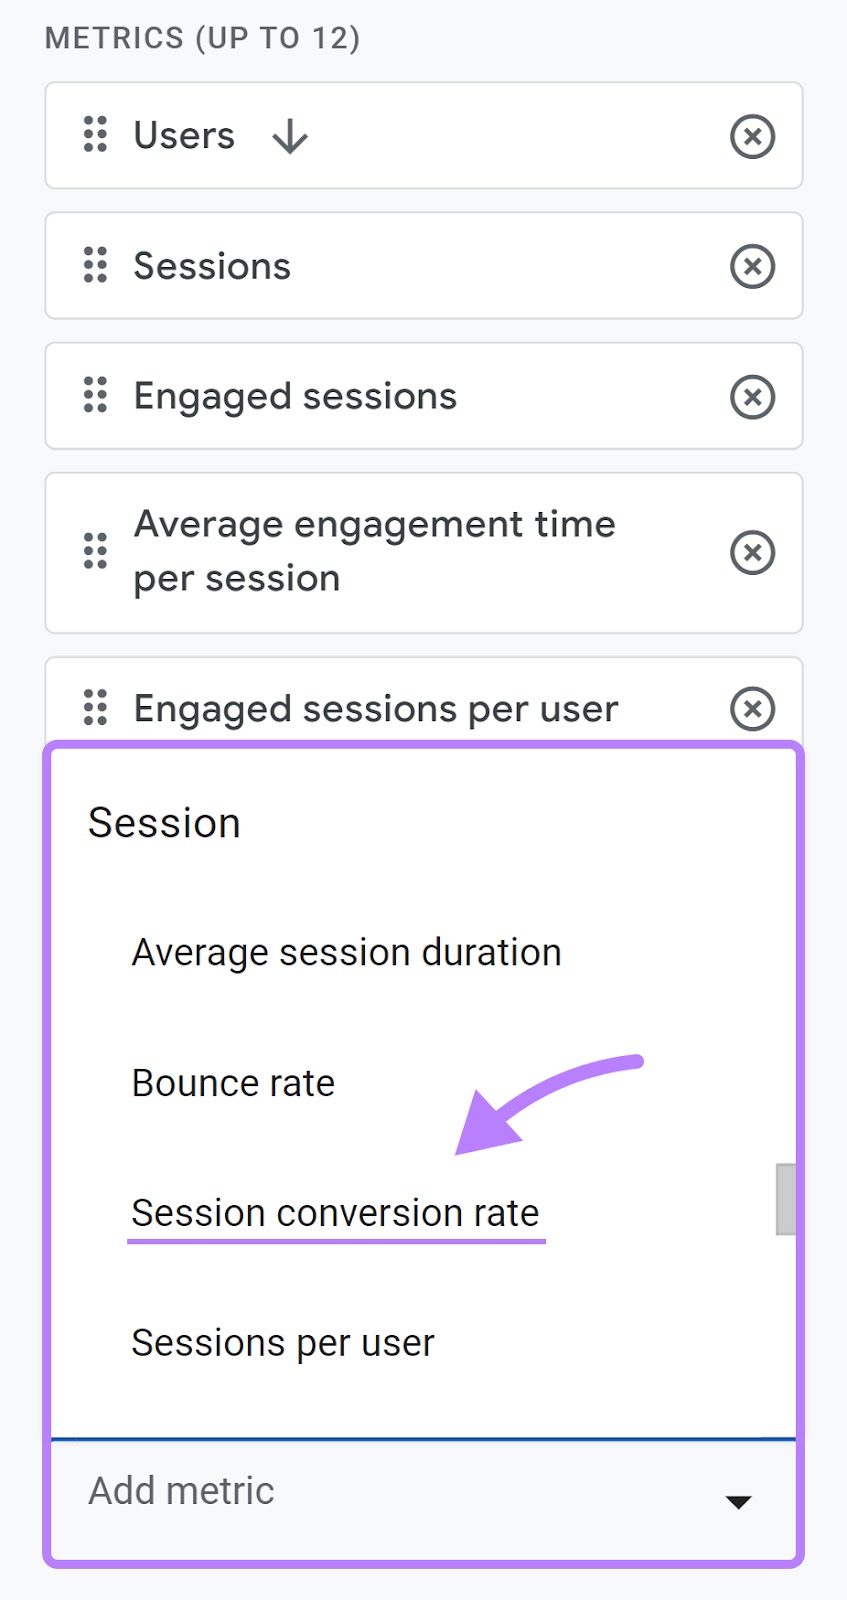
Then, click “Apply.”
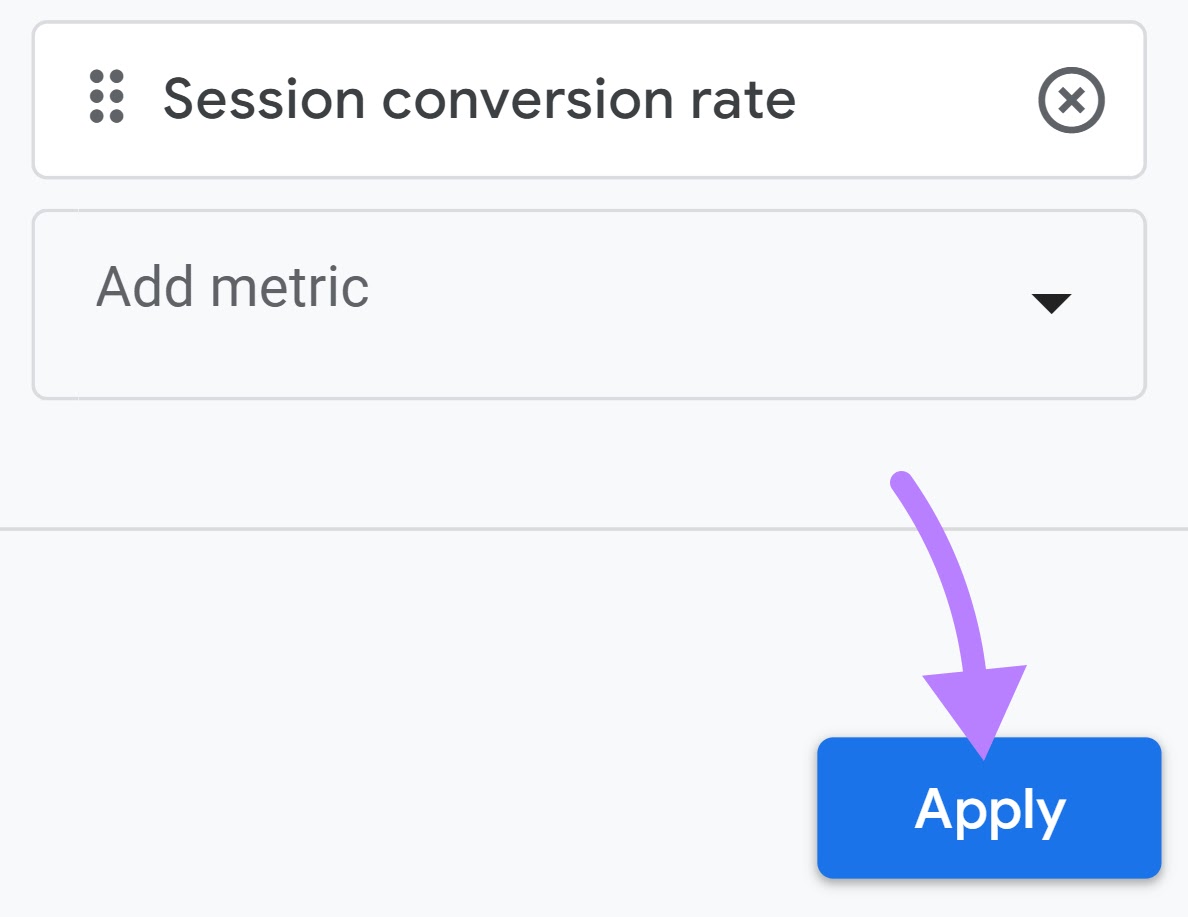
You should now see “Session conversion rate” in your “Traffic acquisition report.”
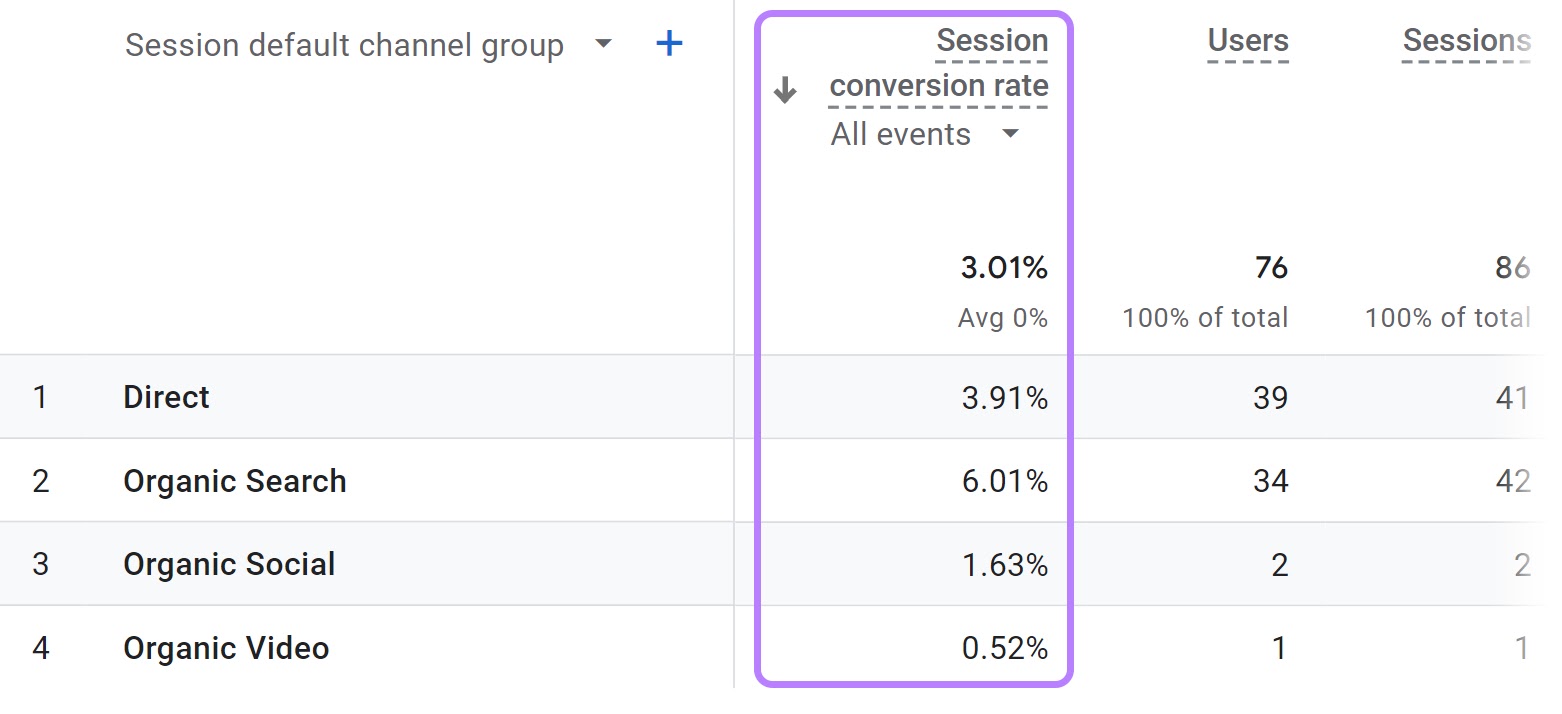
Now that you know your session conversion rate, you should be clear on the performance of your website and marketing efforts in terms of driving valuable actions.
7. Entrances
The “Entrances” metric shows the number of sessions that began on a particular page.
Every time a user initiates a new session, the “Entrances” metric for that particular page where the session begins increases.
This metric is important for understanding how users begin their journey on your site.
To see the “Entrances” metric in GA4, follow these steps:
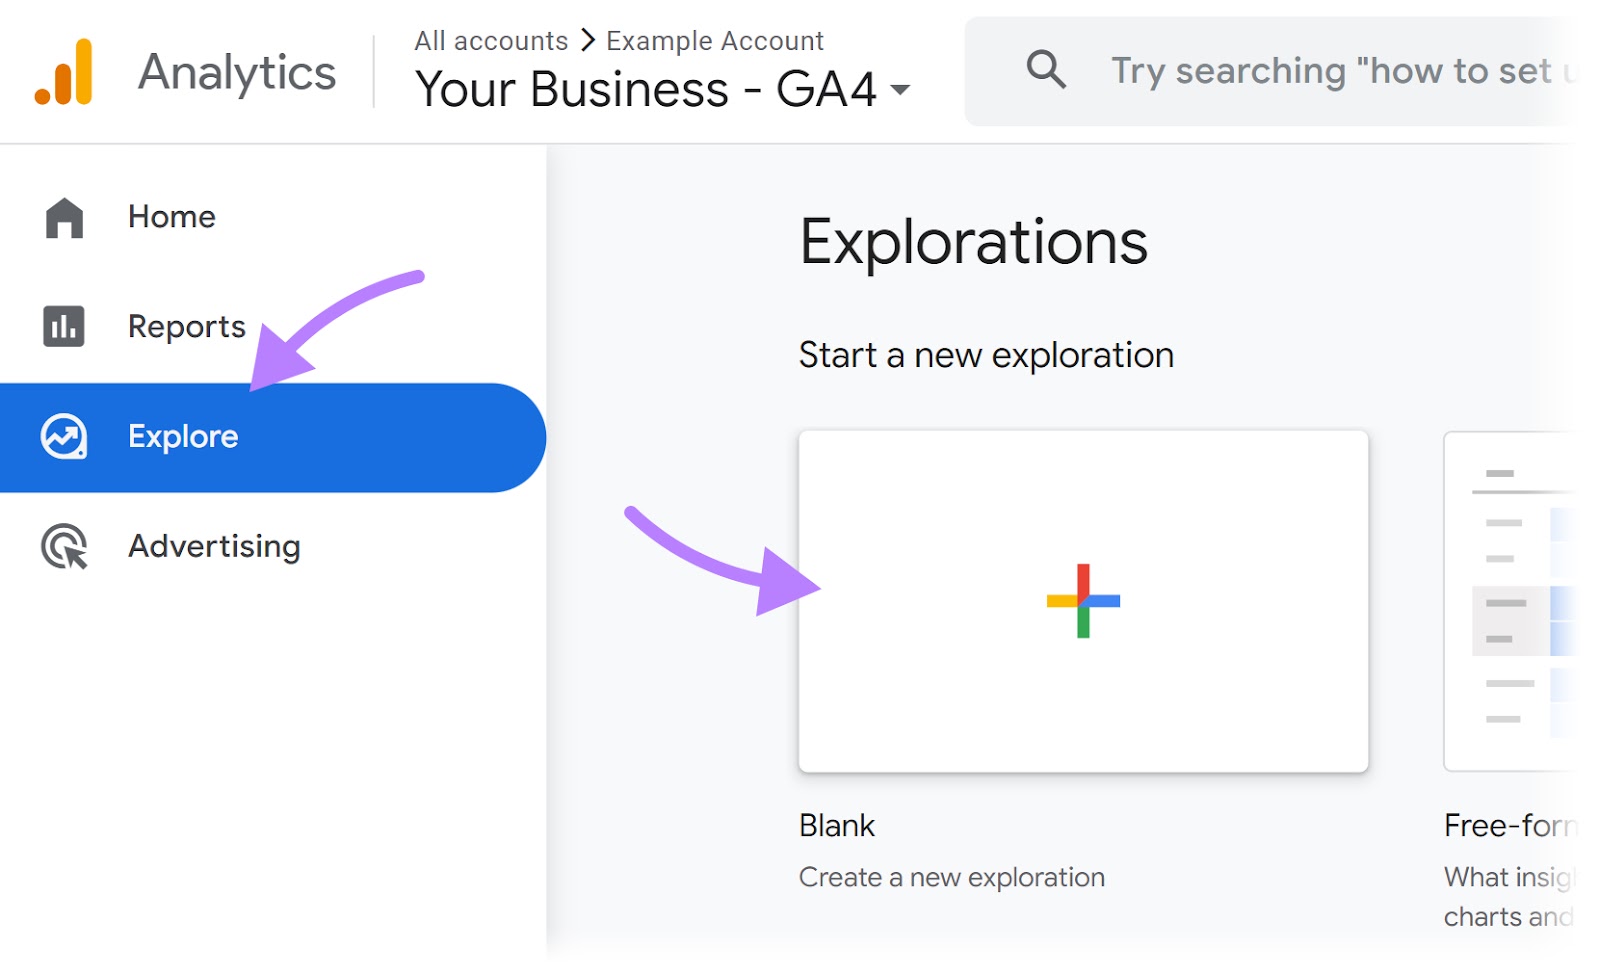
1. Go to the “Explore” area in your GA dashboard
2. Click on “Blank” to start a new exploration
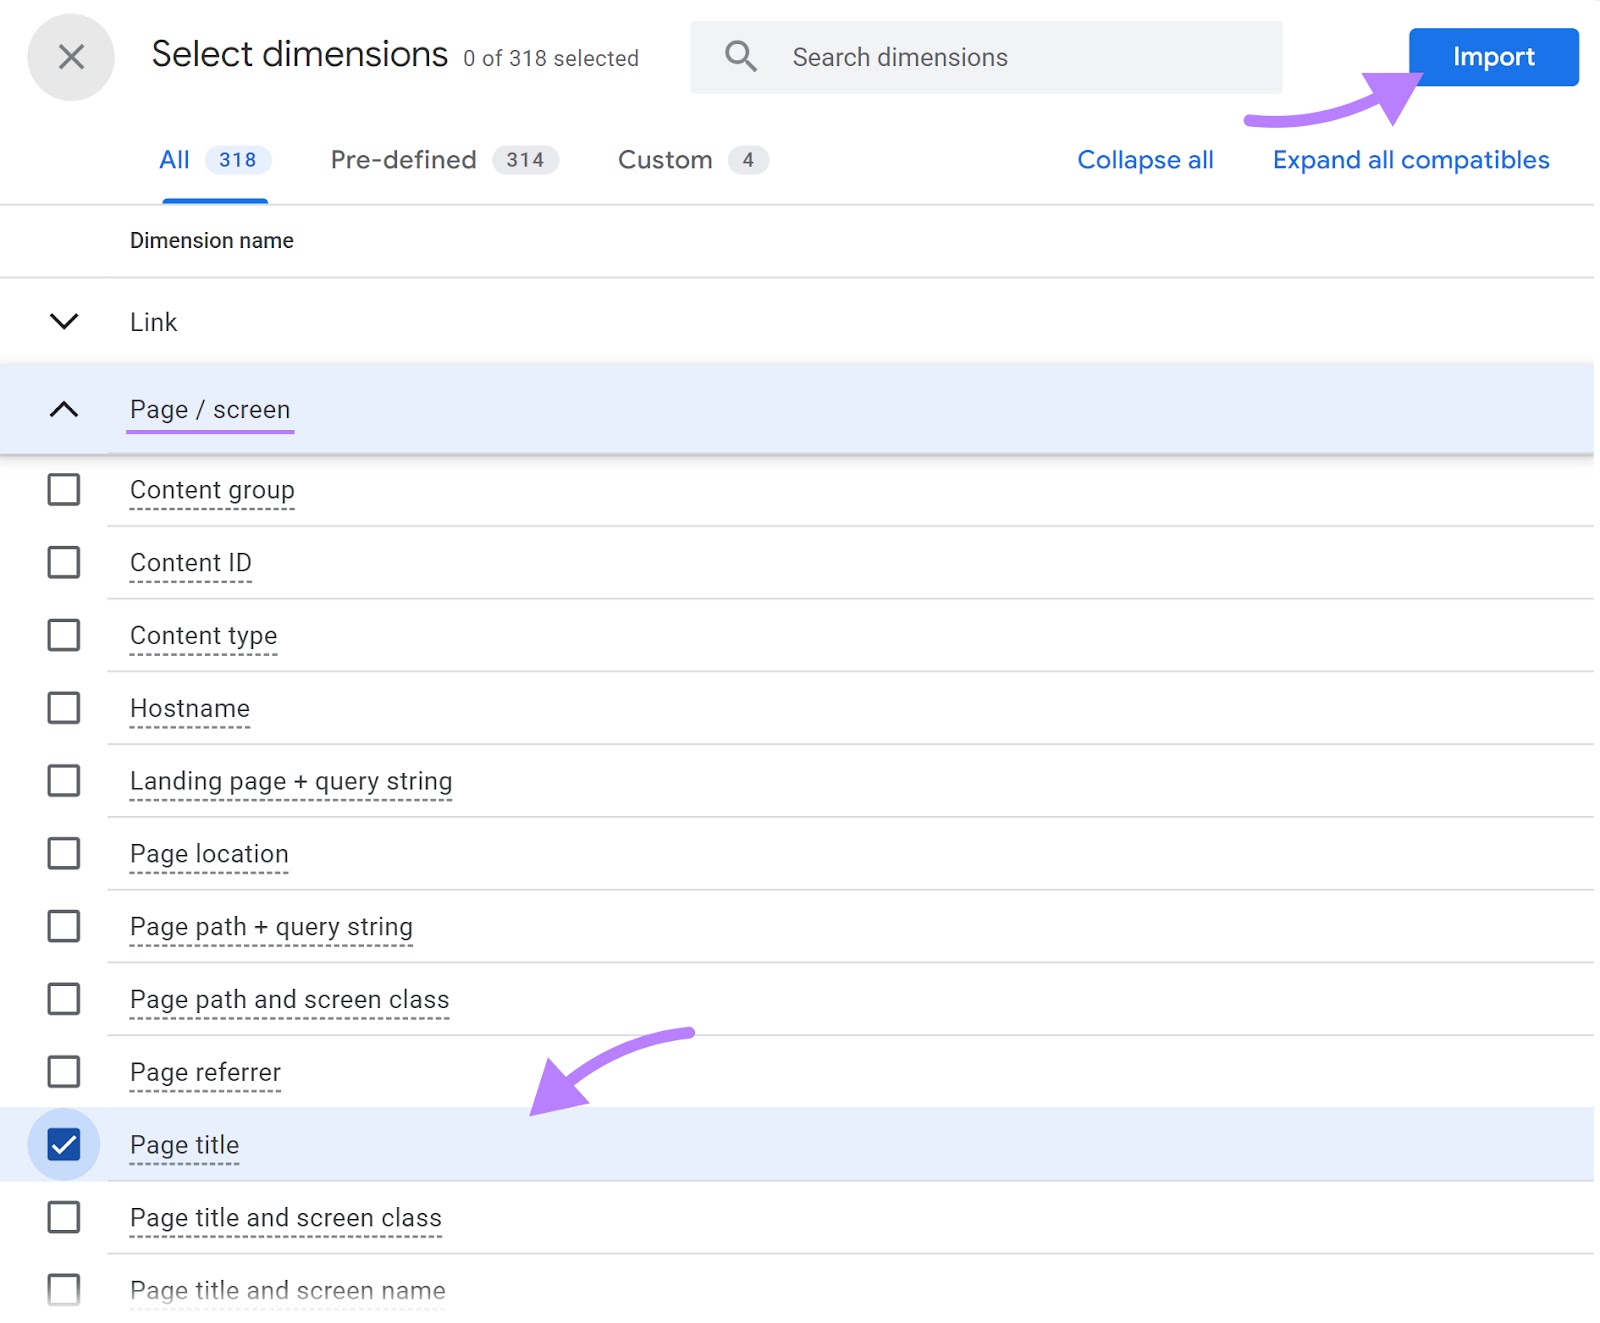
3. Click on the “+” icon next to “DIMENSIONS.”
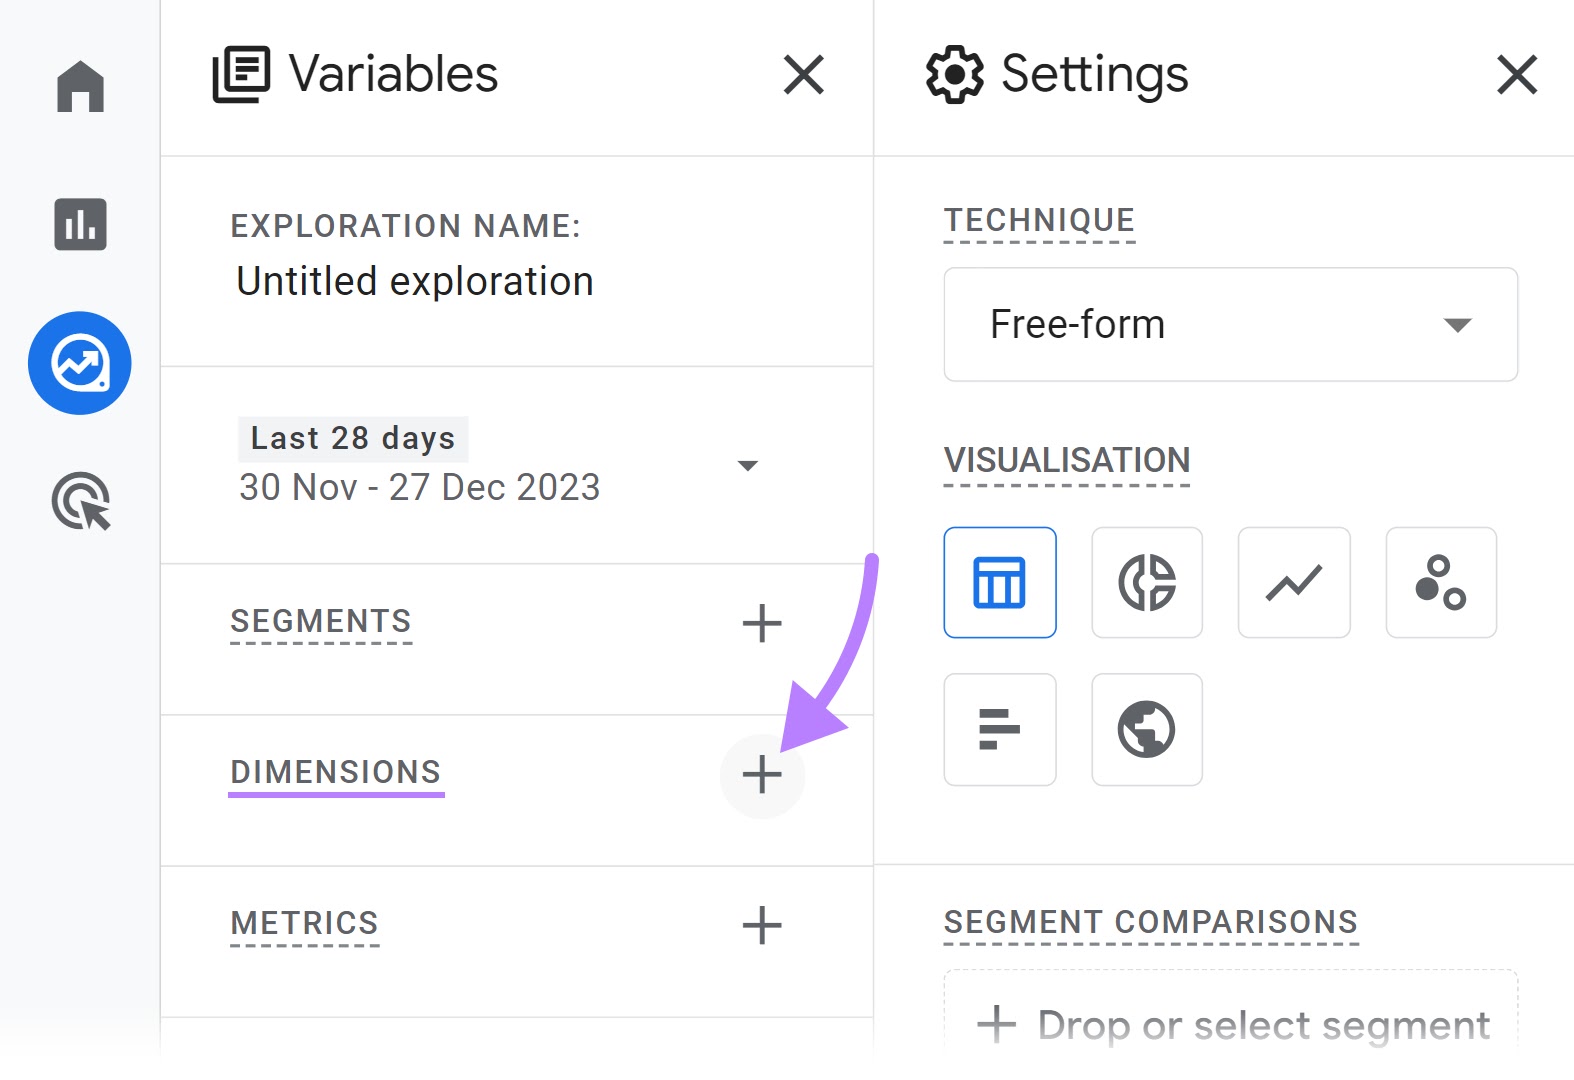
A new window will open up.
4. Select “Page title” (found under the “Page / screen” category)
5. Click on “Import” to add it to your exploration
6. Click on the “+” icon next to “METRICS”
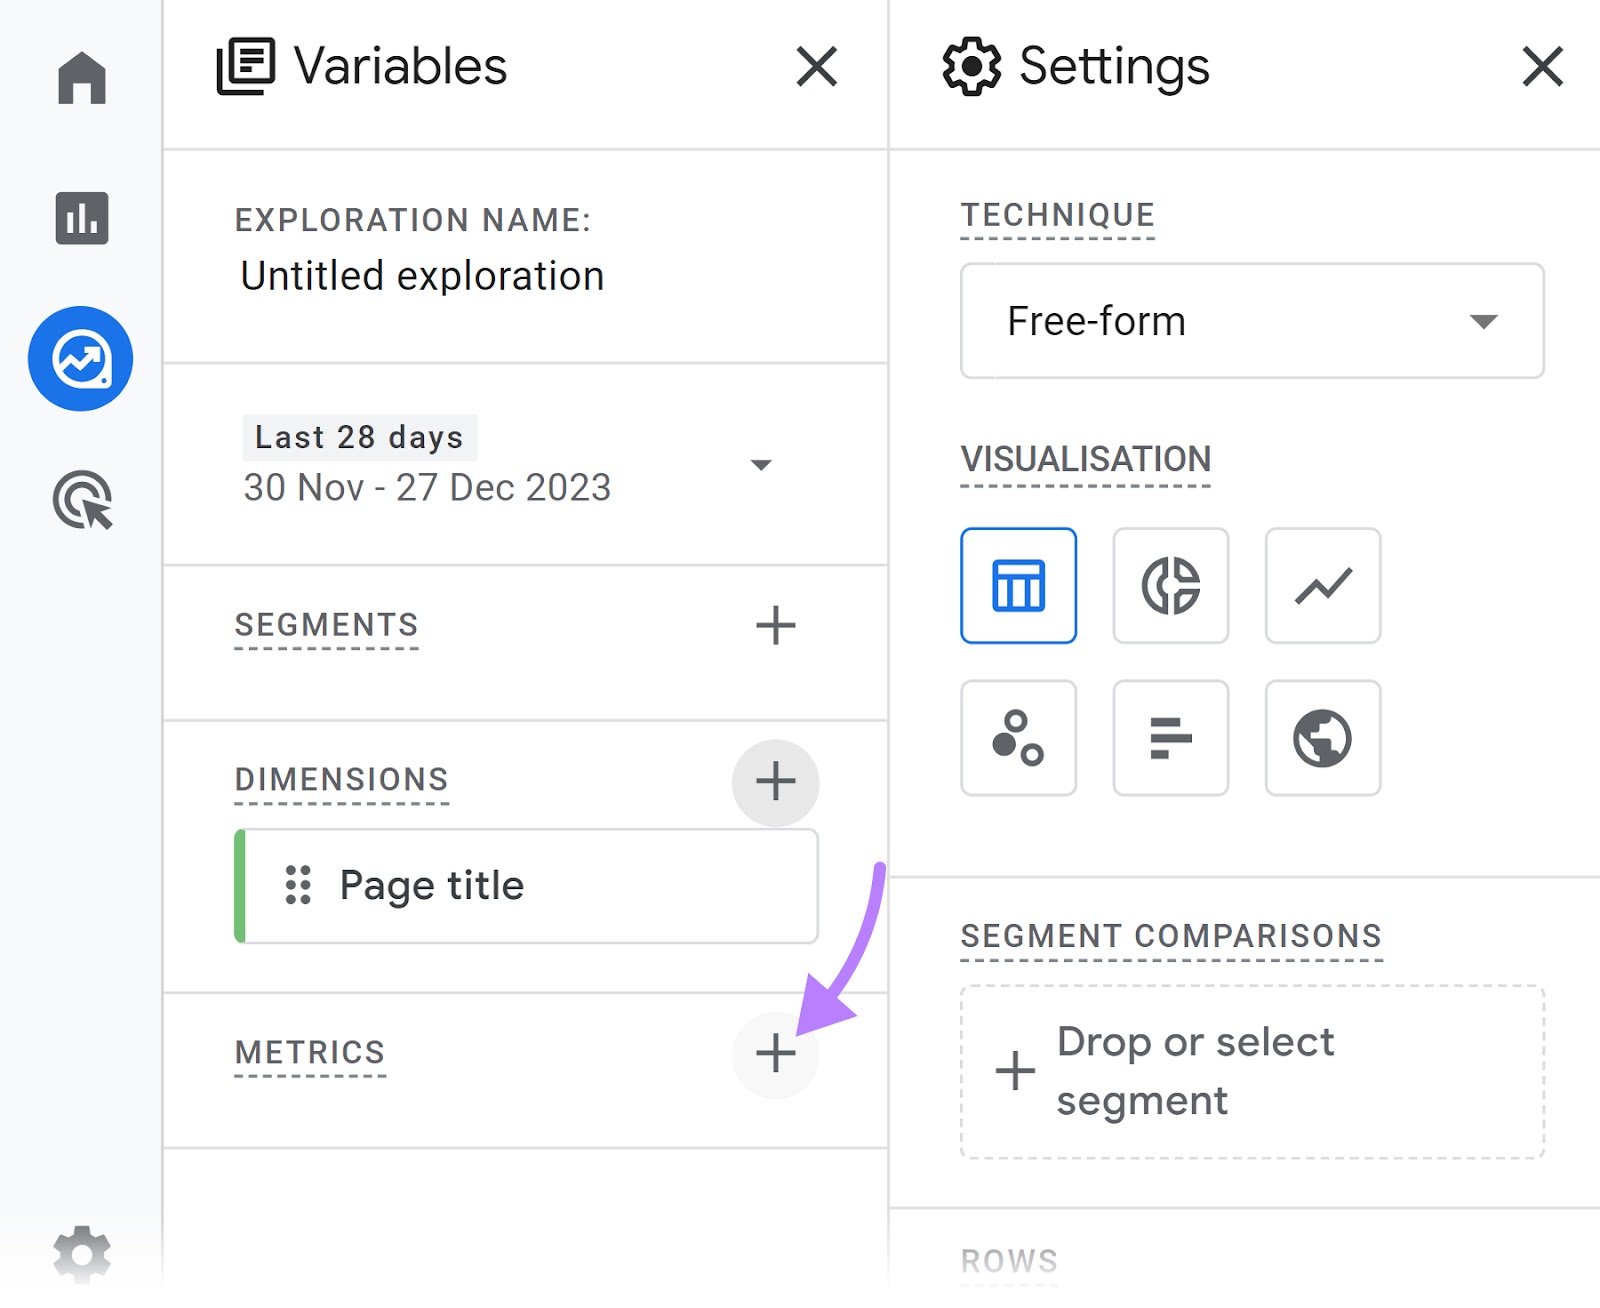
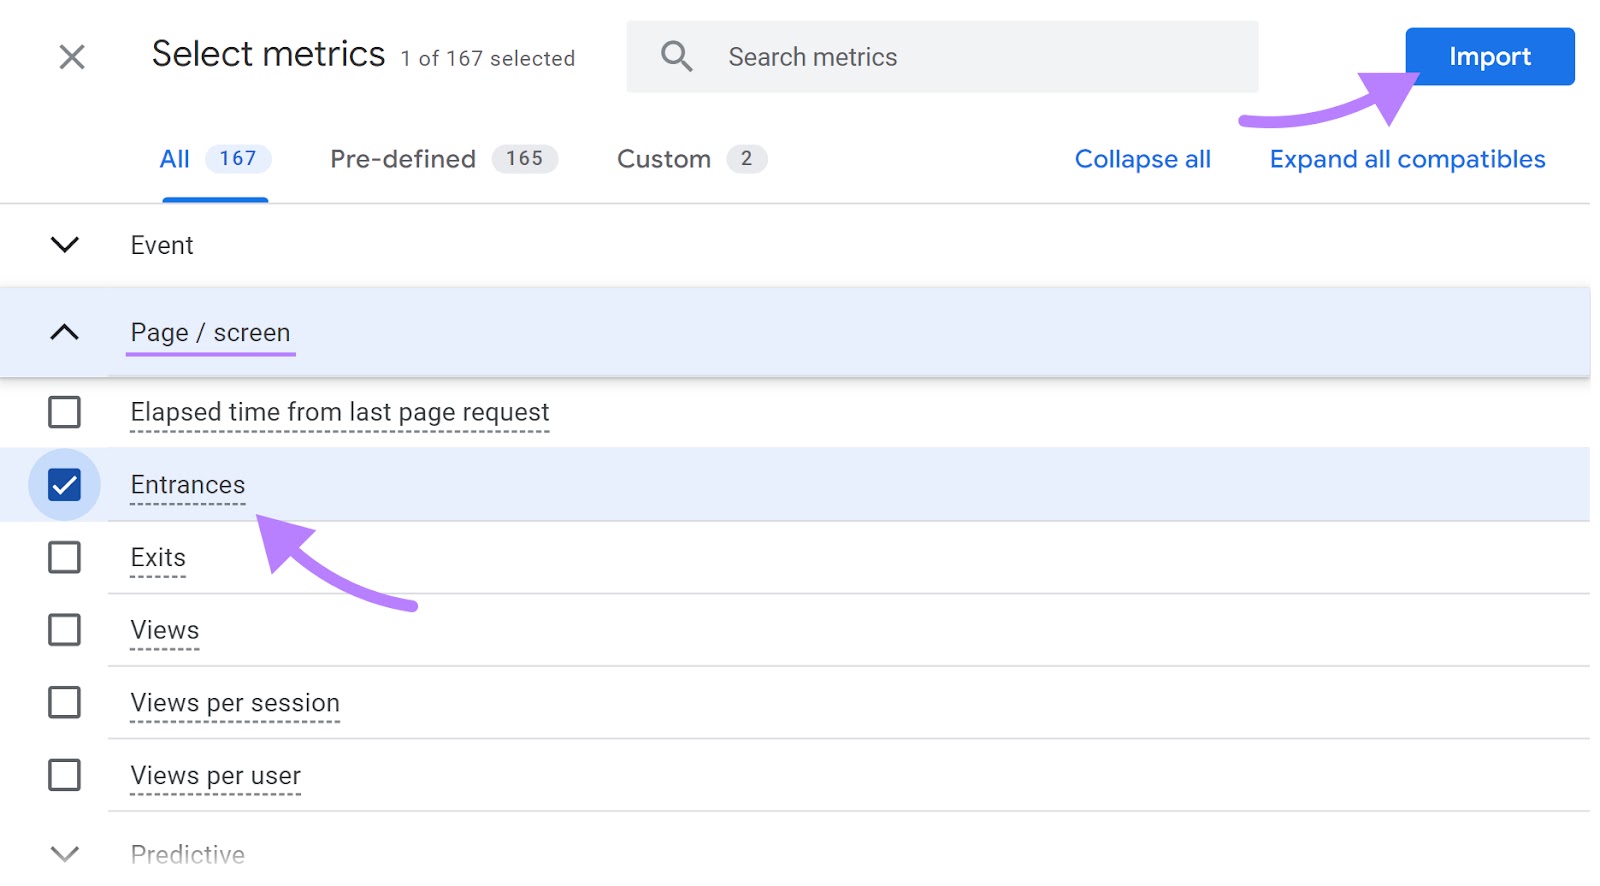
7. Find and select “Entrances” under the “Page / screen” category
8. Click on “Import” to include this metric in your analysis
9. Drag “Page title” into the “ROWS” area. This will list the pages as row headers.
10. Drag the “Entrances” metric to the “VALUES” area. This will display the number of entrances started on each page.
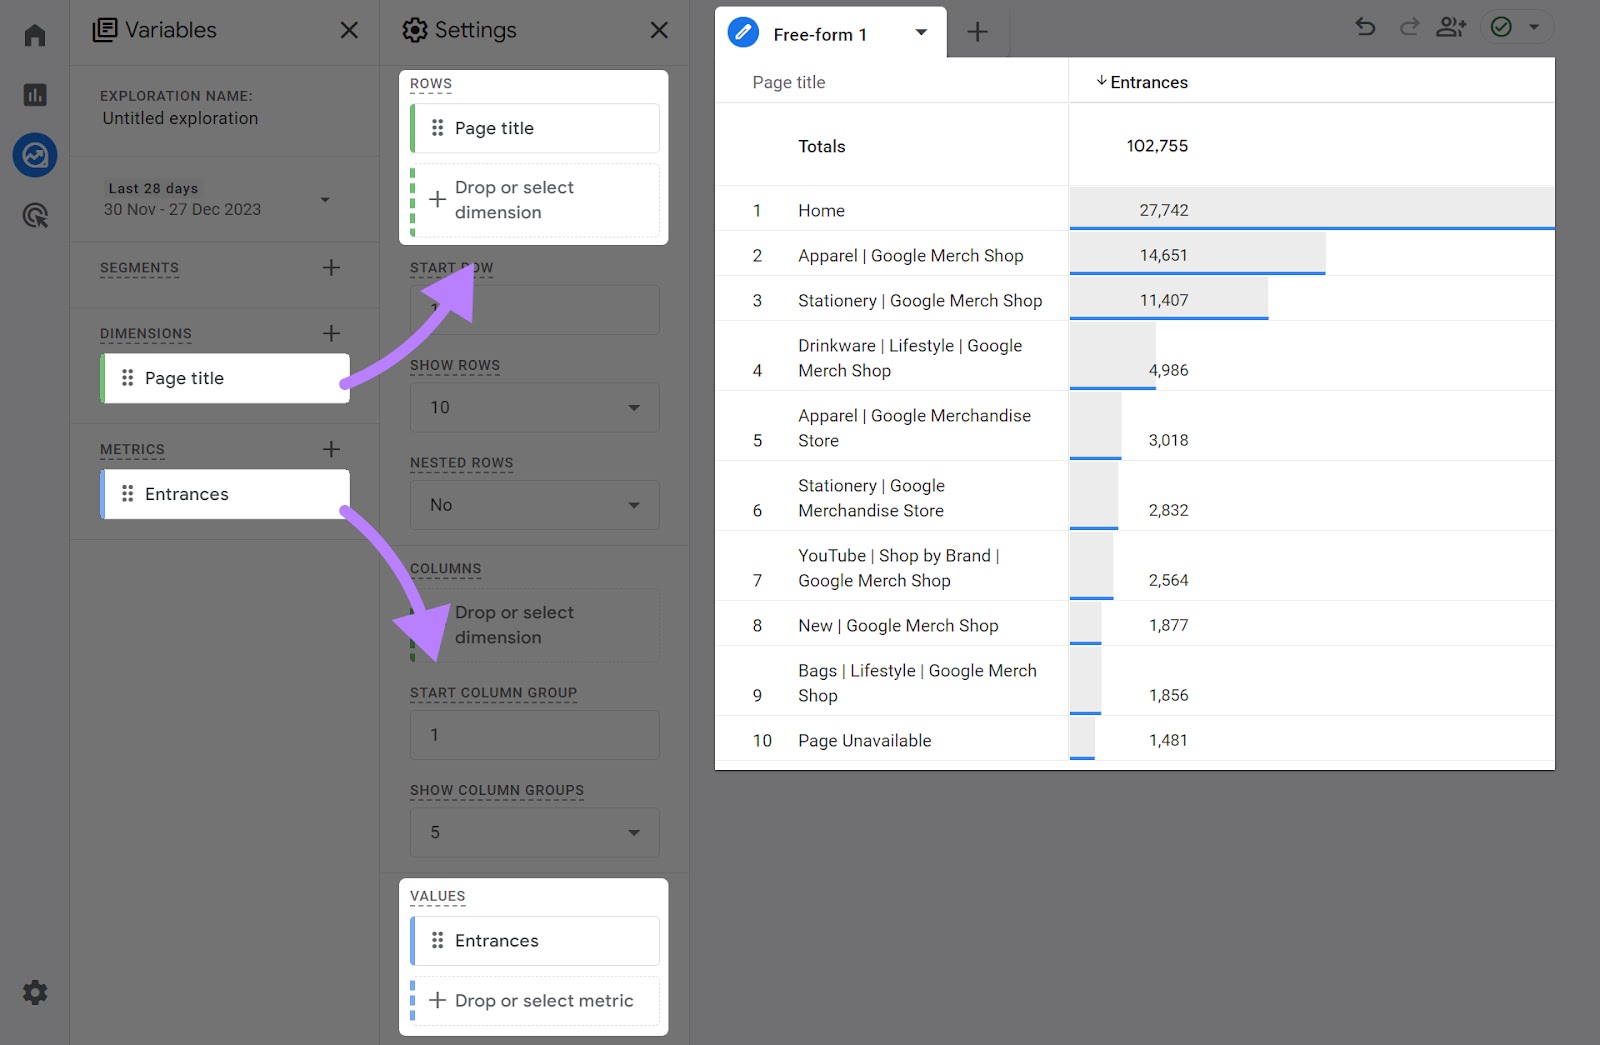
Now that you know which pages people generally “enter” your site from, make sure those pages are engaging and clear. So that they convert better.
8. Exits
The “Exits” metric shows how many sessions ended on a particular page.
For example, if five people ended their engagement with your website on your pricing page, then your pricing page will have five “Exits.”
This metric is crucial for identifying which pages are most commonly the last interaction point before users leave your site.
To see your exit counts in GA4, follow these steps:
1. Navigate to the “Explore” section in your dashboard
2. Click “Blank” to start a new exploration

3. Click on the “+” icon next to “DIMENSIONS”

A new window will pop up.
4. Select “Page title” (under the “Page / screen” category)
5. Click on “Import” to add it to your exploration

6. Click on the “+” icon next to “METRICS”

7. Find and select “Exits” under the “Page / screen” category
8. Click on “Import” to include this metric in your analysis
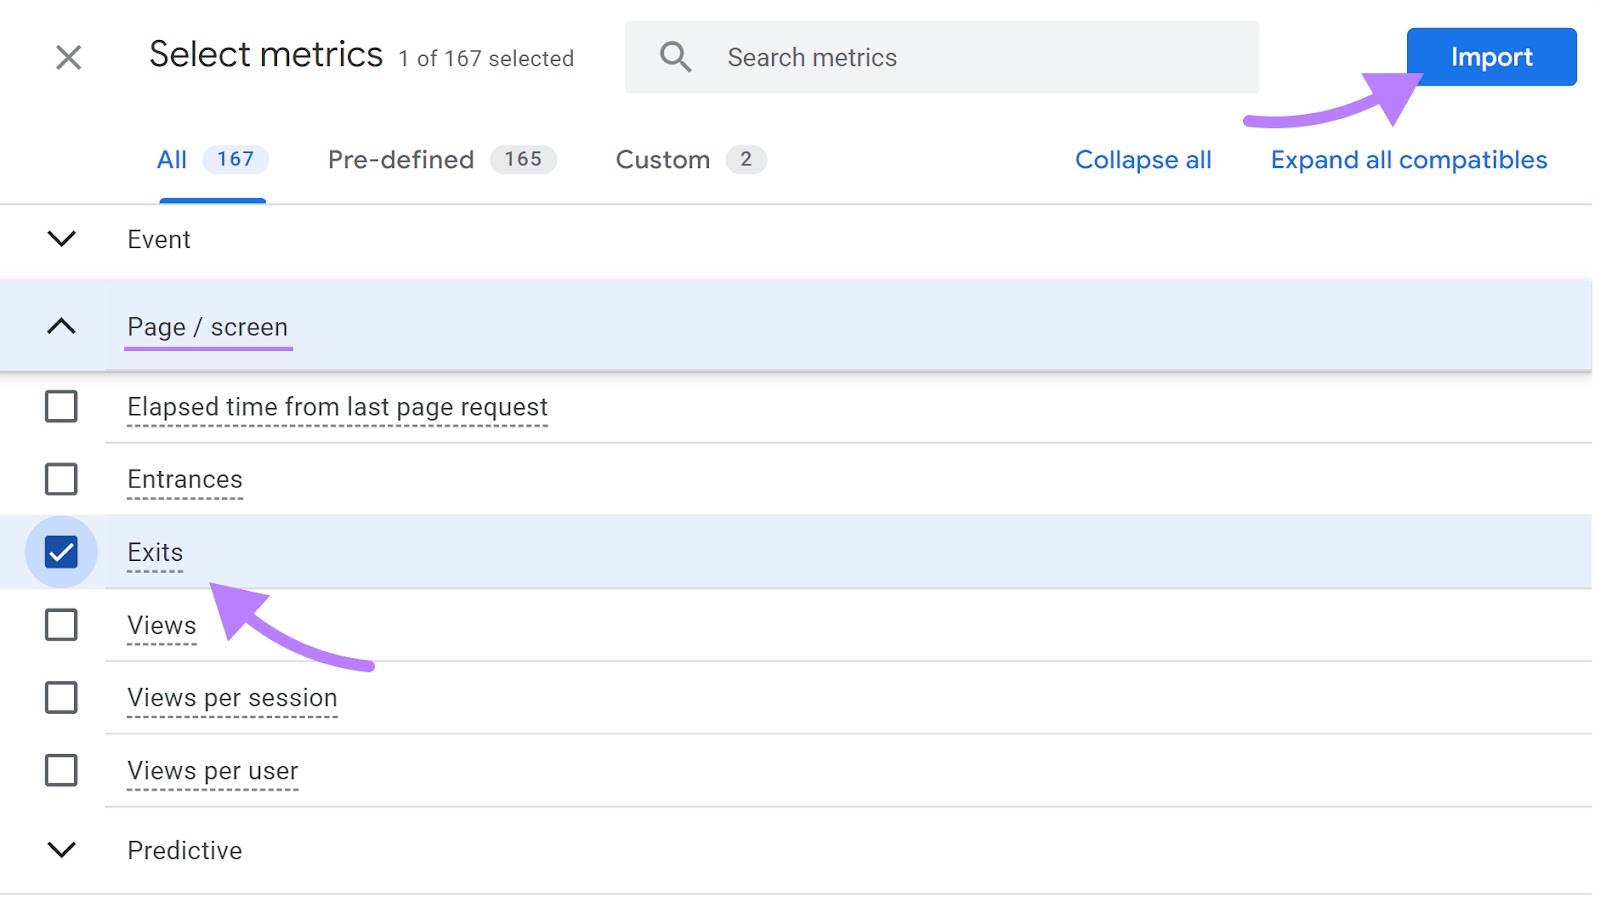
9. Drag “Page title” into the “ROWS” area. This will list the pages as row headers.
10. Drag the “Exits” metric to the “VALUES” area. This will display the exit counts for each page.
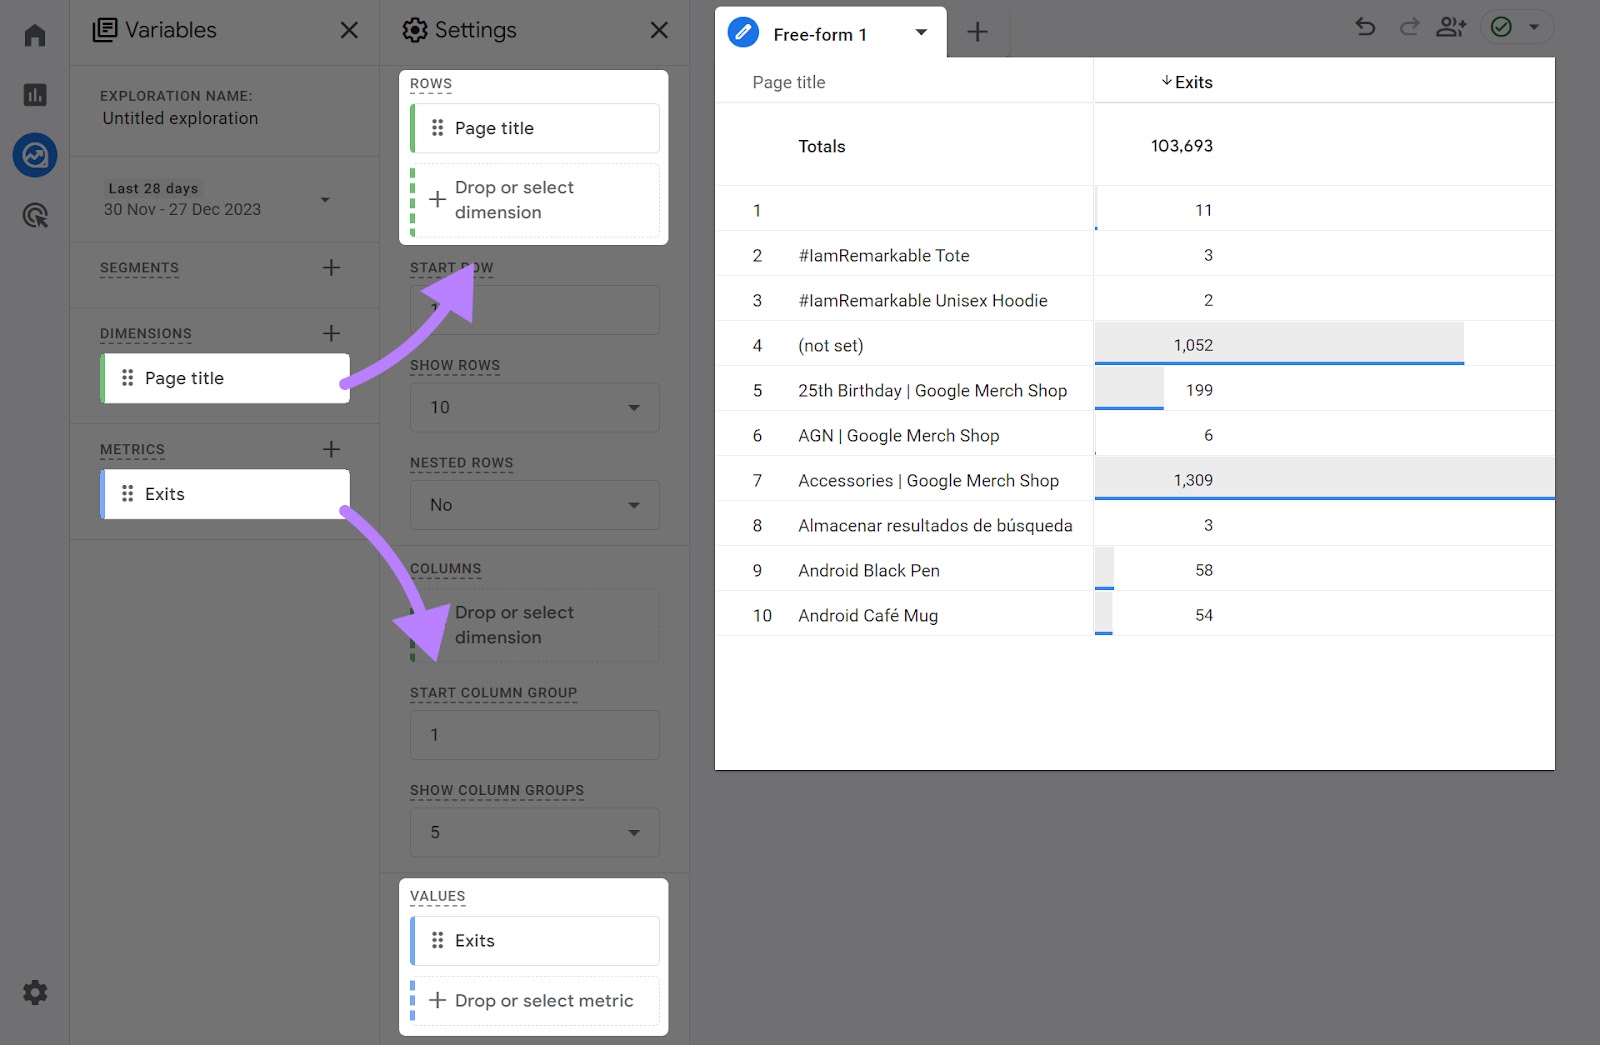
Try to identify any common patterns among the pages with high exits.
Are these pages lacking engaging content? Do they have a confusing layout or navigation?
Understanding these patterns can help you pinpoint areas for improvement.
9. Views Per User
The “Views per user” metric shows the average number of pages users see during a specified time frame.
It is calculated by dividing the total number of page views by the total number of users in the same time frame.
A higher “Views per user” signals you're creating sticky content that keeps users engaged. Prompting them to further explore your website.
To check your “Views per user” metric in GA4, go to “Reports” > “Life cycle” > “Engagement” > “Pages and screens.”
The report will now show the average pages each user sees during a session.

If you want to improve this metric, make sure your navigation menu is well-designed and promotes further site exploration.
Also, strengthen internal linking between related content. Our internal linking guide covers exactly how to do that.
10. Engaged Sessions
The “Engaged session” metric measures any time a session lasts longer than 10 seconds, has at least two page views, or triggers a conversion event.
A high number of engaged sessions suggests your site is meeting the needs and expectations of your users.
Otherwise, users wouldn’t be engaging with your site.
To find engaged sessions in GA4, go to “Reports” > “Life cycle” > “Acquisition” > “Traffic acquisition.”
Here, you’ll see the total number of engaged sessions and how they are distributed across multiple traffic sources.
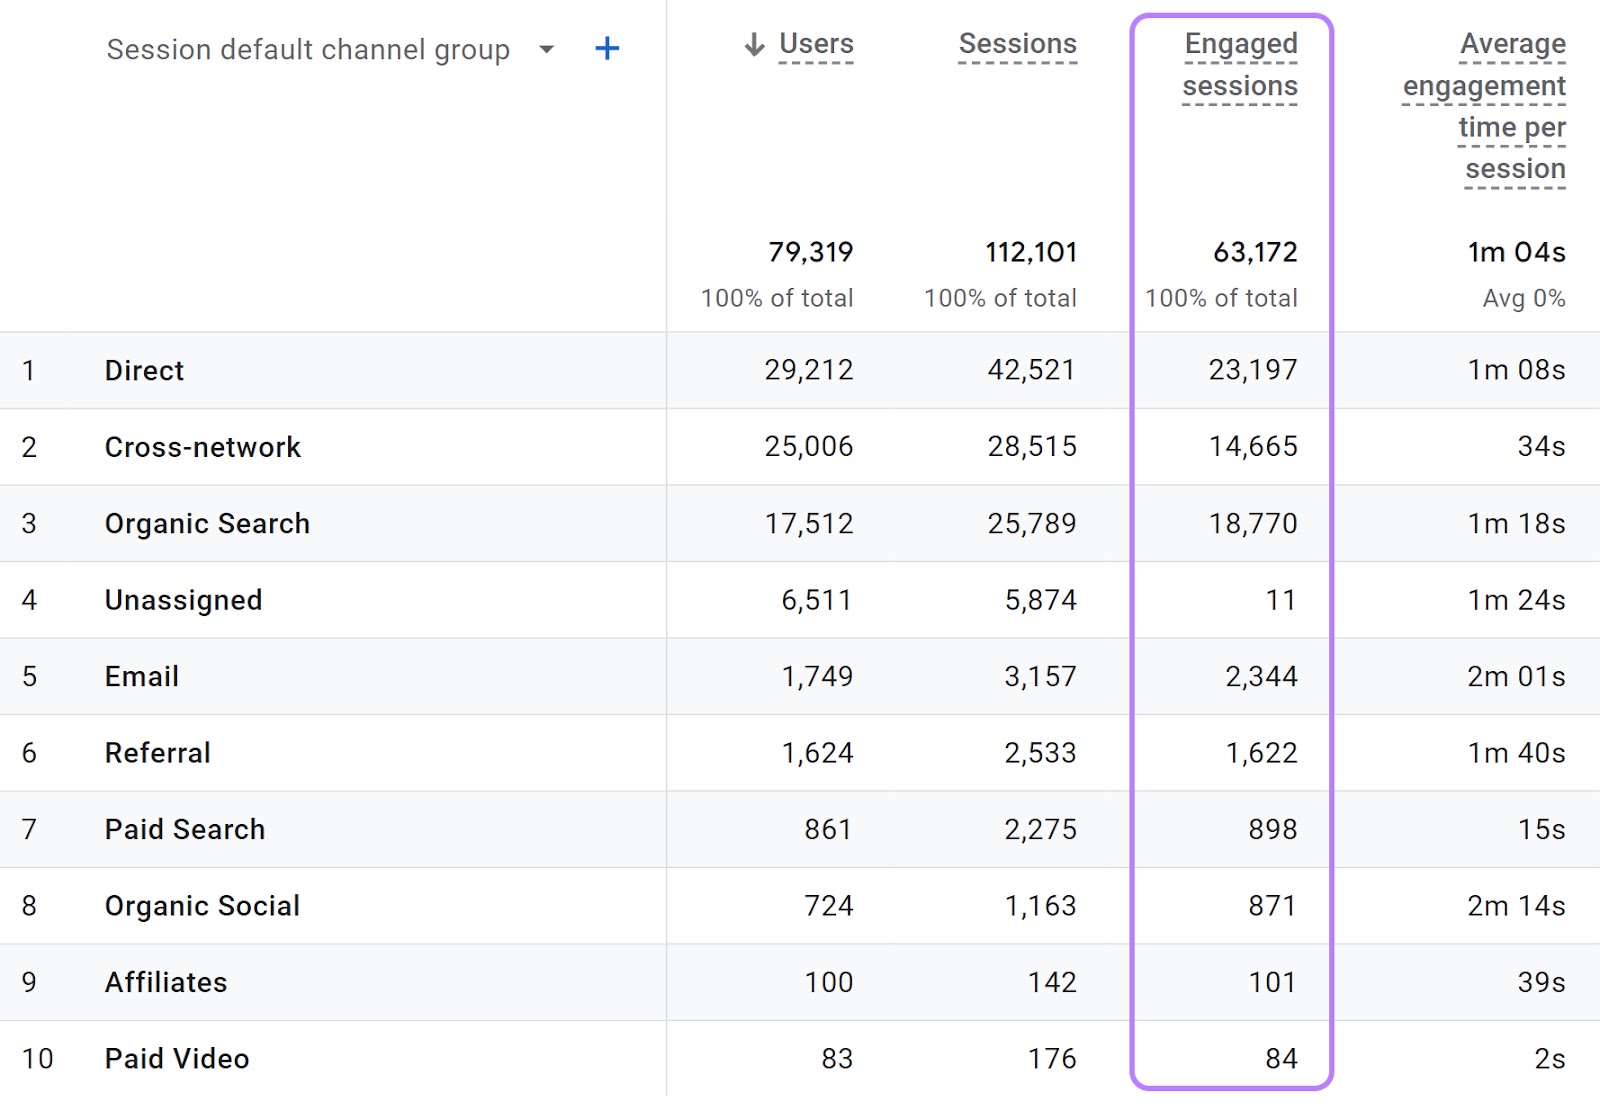
Consider prioritizing channels that are bringing in a high number of engaged sessions.
11. Engagement Rate
The “Engagement rate” represents the percentage of engaged sessions. Compared to the total number of sessions.
A session is considered engaged any time it lasts longer than 10 seconds, has at least two page views, or triggers a conversion event.
This metric provides a clear indicator of how effectively your site captures and holds the attention of users.
To check your engagement rate, go to “Reports” > “Life cycle” > “Acquisition” > “Traffic acquisition.”
Then scroll to the right side of the report. You’ll see your engagement rate across different traffic channels.
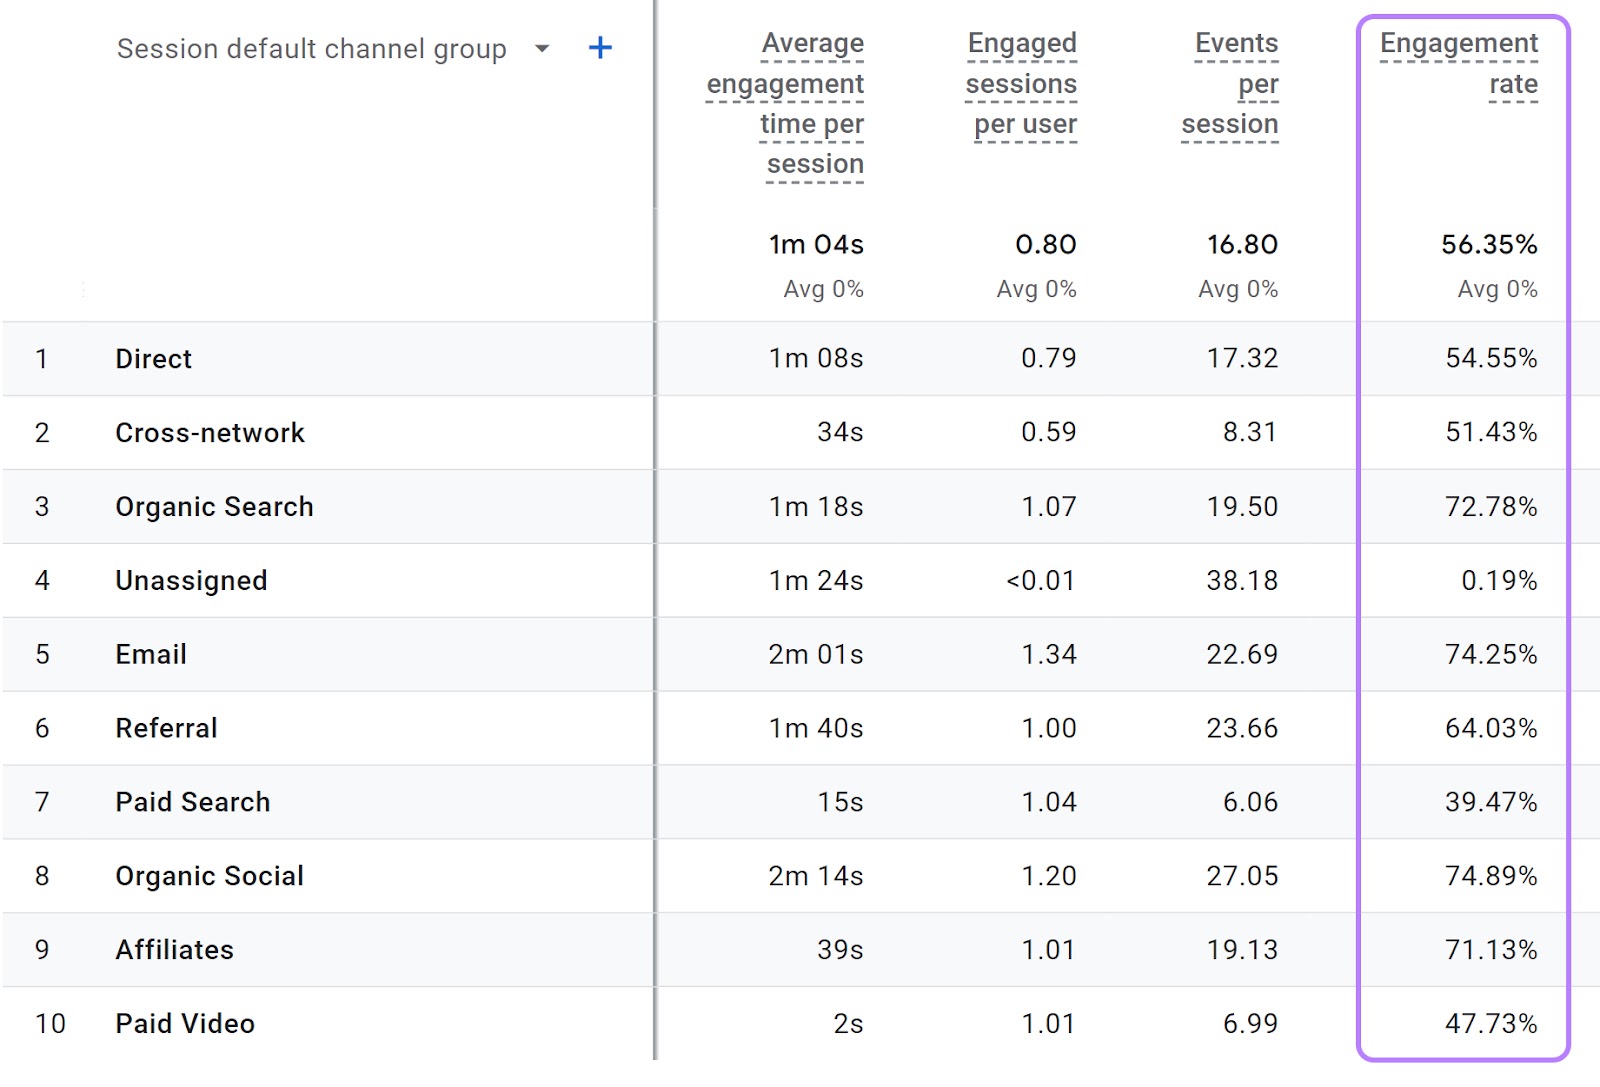
Once again, prioritize channels that are already performing well for you.
12. Returning Users
The “Returning users” metric shows the number of users who visited your site more than once during the selected time frame.
It’s the opposite of first-time visitors (“New users”).
Tracking returning users is key for understanding:
- User retention and loyalty (i.e., whether users keep coming back)
- How well you convert new users into repeat visitors
- What part of your audience comes back often
To check your returning users, you need to customize your “User acquisition” report.
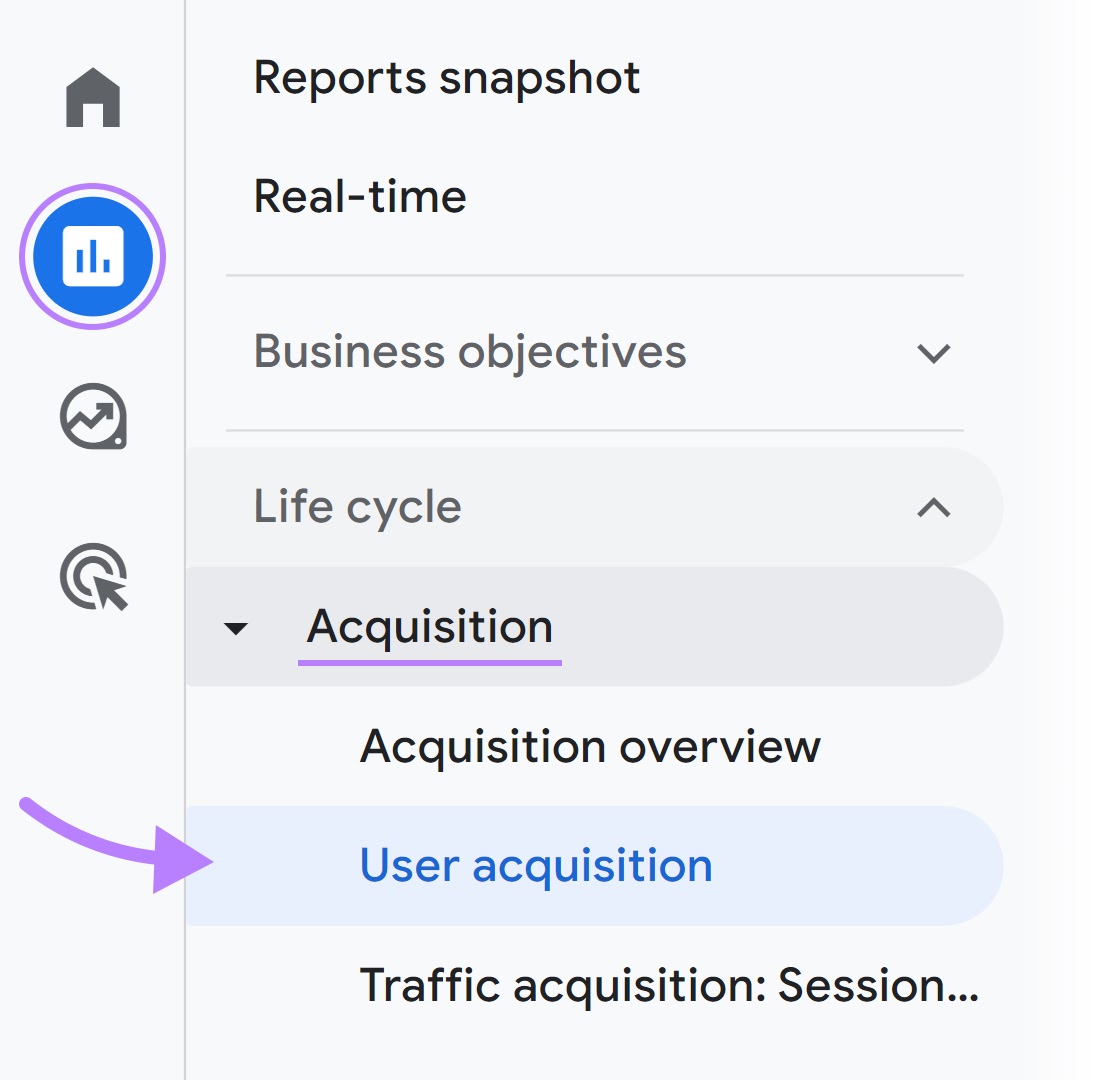
Go to “Reports” > “Life cycle” > “Acquisition” > “User acquisition.”
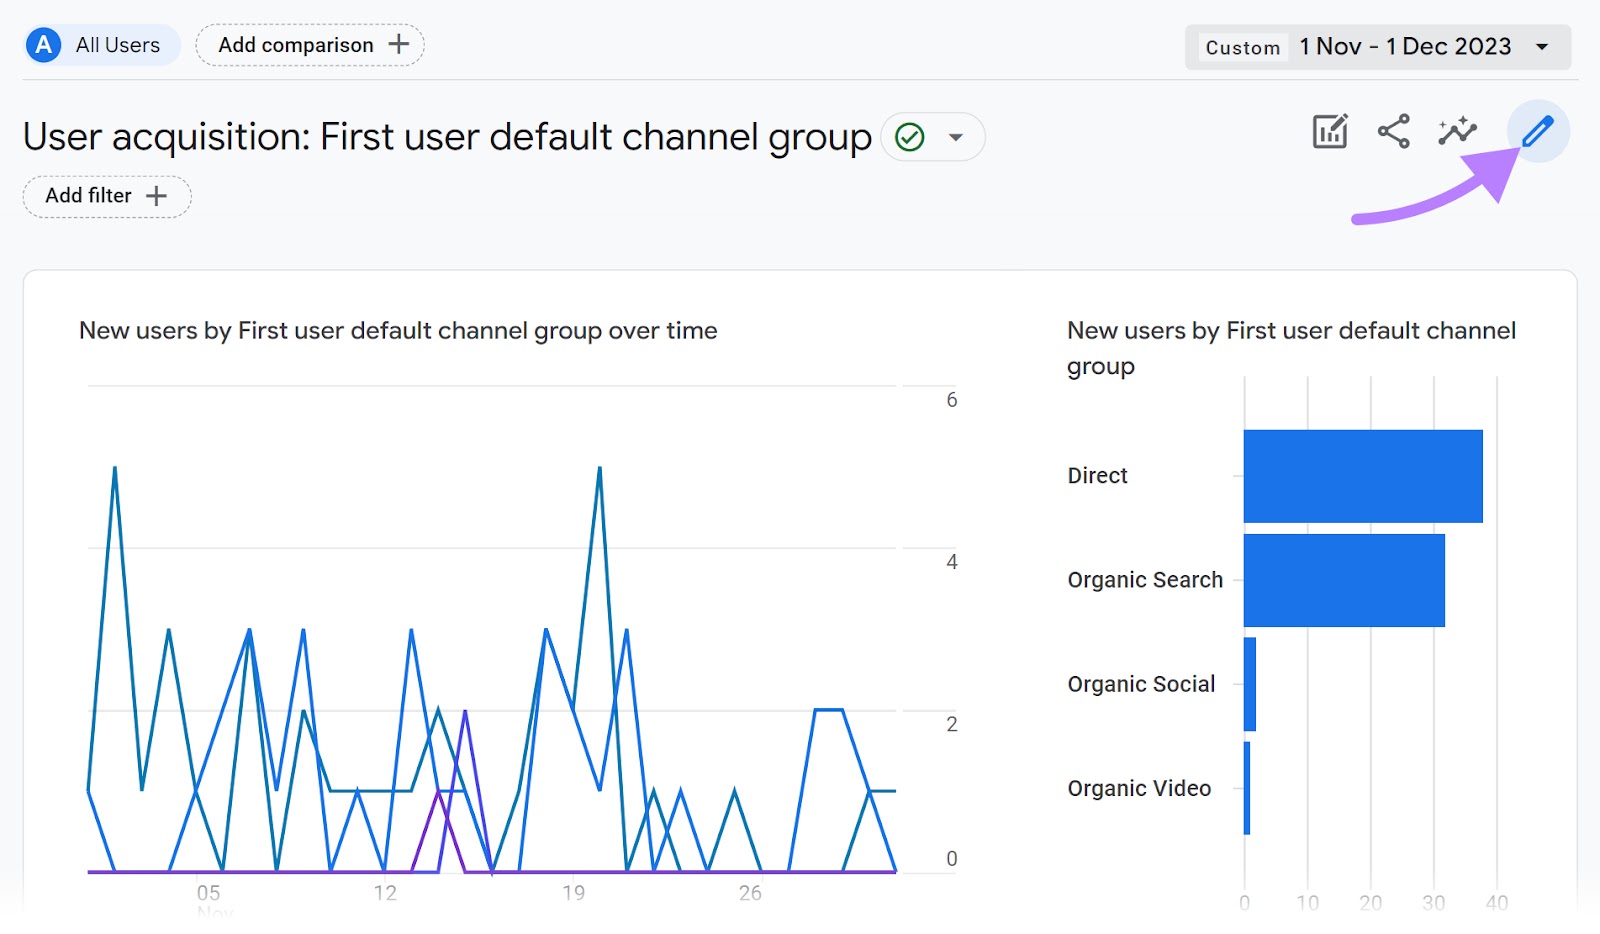
On the top right of your screen, click the pencil icon to customize your report.
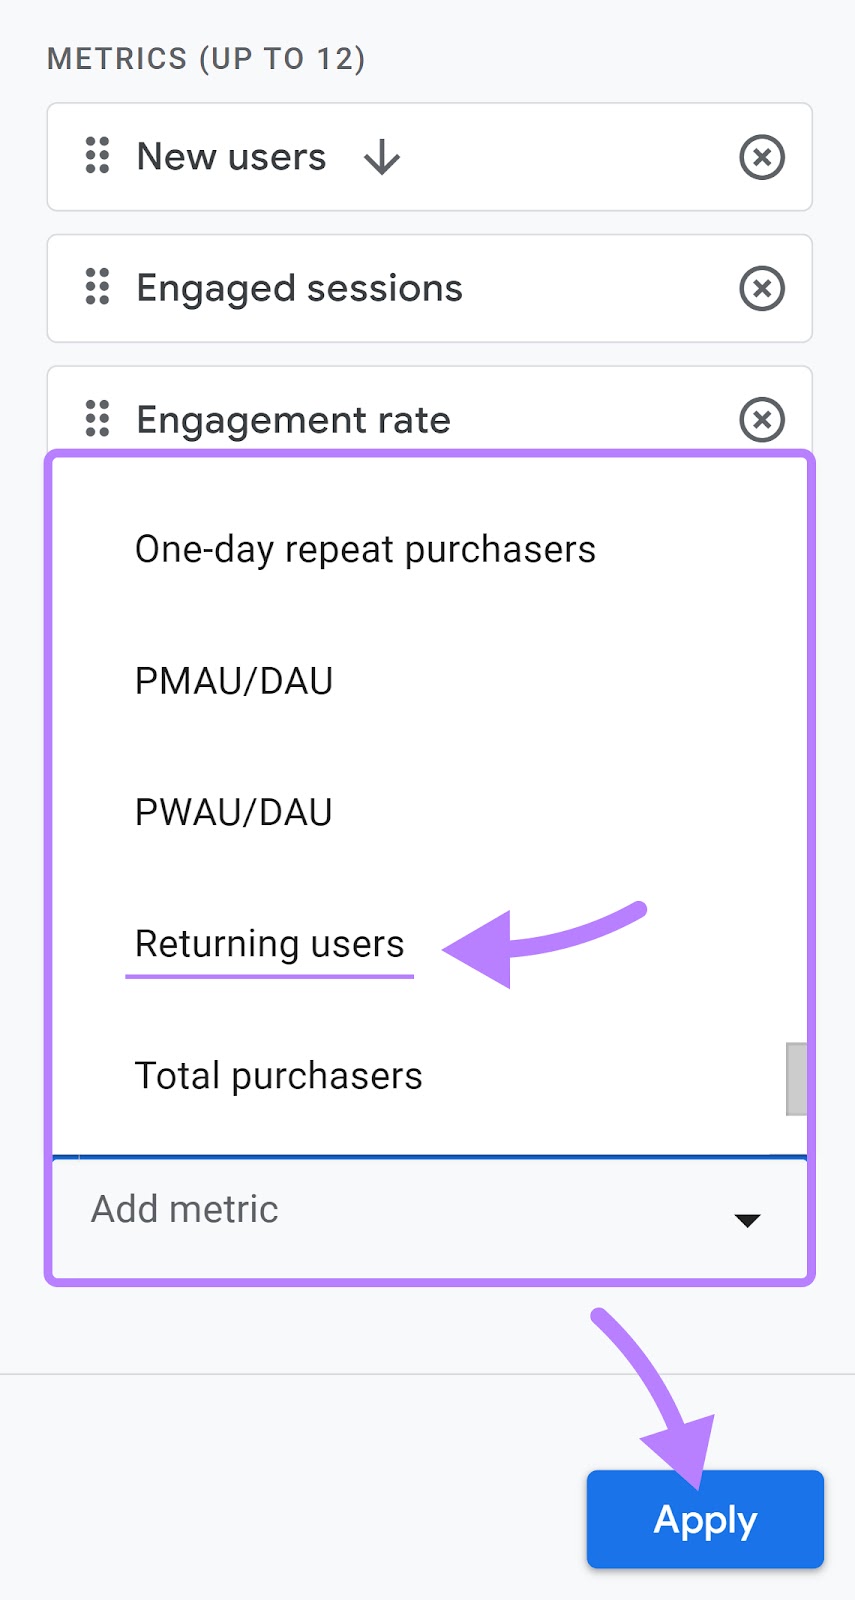
Choose “Metrics” from the “Report Data” section.

From the “Add metric” drop-down, choose “Returning users.” And click “Apply.”
You should now see the returning users in your “User acquisition” report.
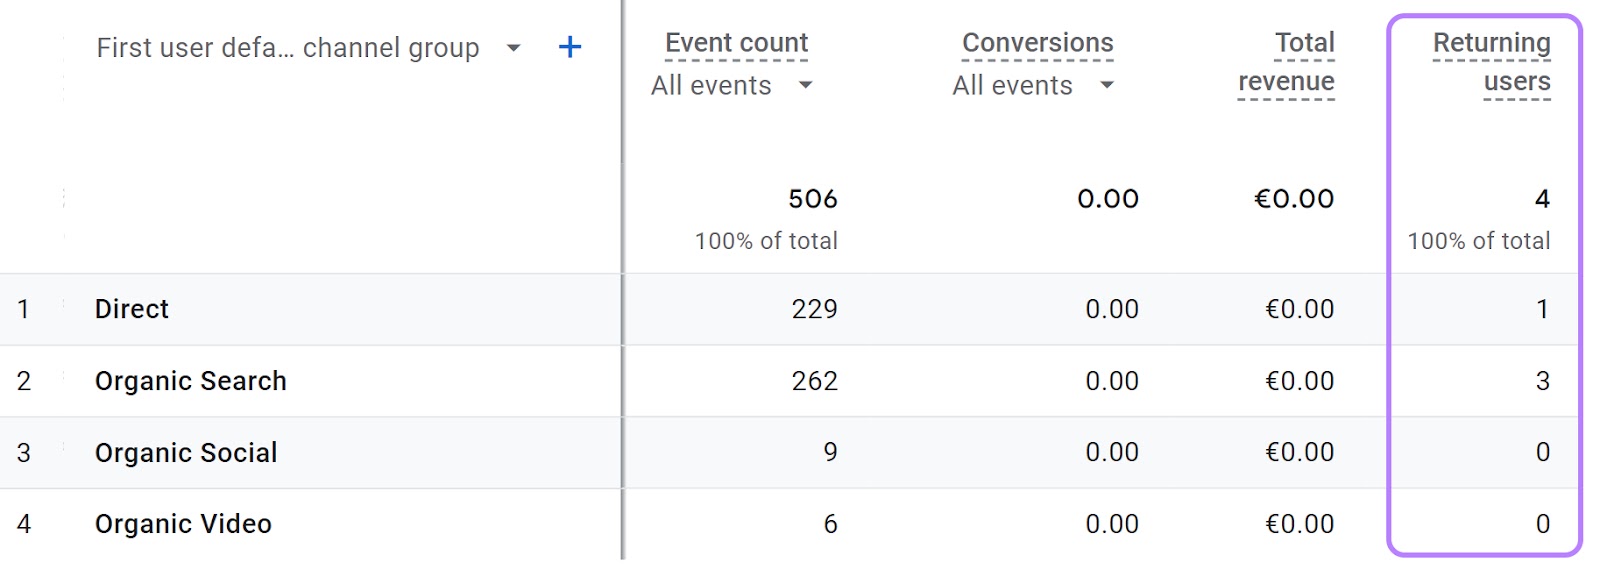
Use this metric to determine whether you need to create more targeted and effective retention strategies.
If it’s high, keep on doing what you’re doing. If it’s low, look into new marketing campaigns.
This might include personalized email campaigns, loyalty programs, or content that caters to the interests of these repeat visitors.
Which Metrics Should You Track?
The Google Analytics metrics you track should align with your business goals. This way, you can determine what’s going well and what you need to change.
Say you want to understand the user engagement with your website. You might track the “Average engagement time,” “Bounce rate,” and “Views per user” metrics
But if you want to understand how your marketing campaign performed, you might track “Sessions” and the “Session conversion rate.”
If the metric isn’t of interest to you or a part of your business goals, it likely isn’t worth your time to track it. Over time, you’ll get a stronger feel for the Google Analytics website metrics you actually care about.
Integrate Google Analytics with Semrush
If you’re a Semrush user, you can connect GA4 data directly to the Semrush interface.
That allows you to view all your website’s data—including your Google Analytics performance metrics—from a central location. And get even more comprehensive data from Semrush tools.
To get started, open Semrush’s Organic Traffic Insights and connect your Google Analytics account.
Once you’ve done that, you’ll see all your important metrics in a single dashboard. Like this:
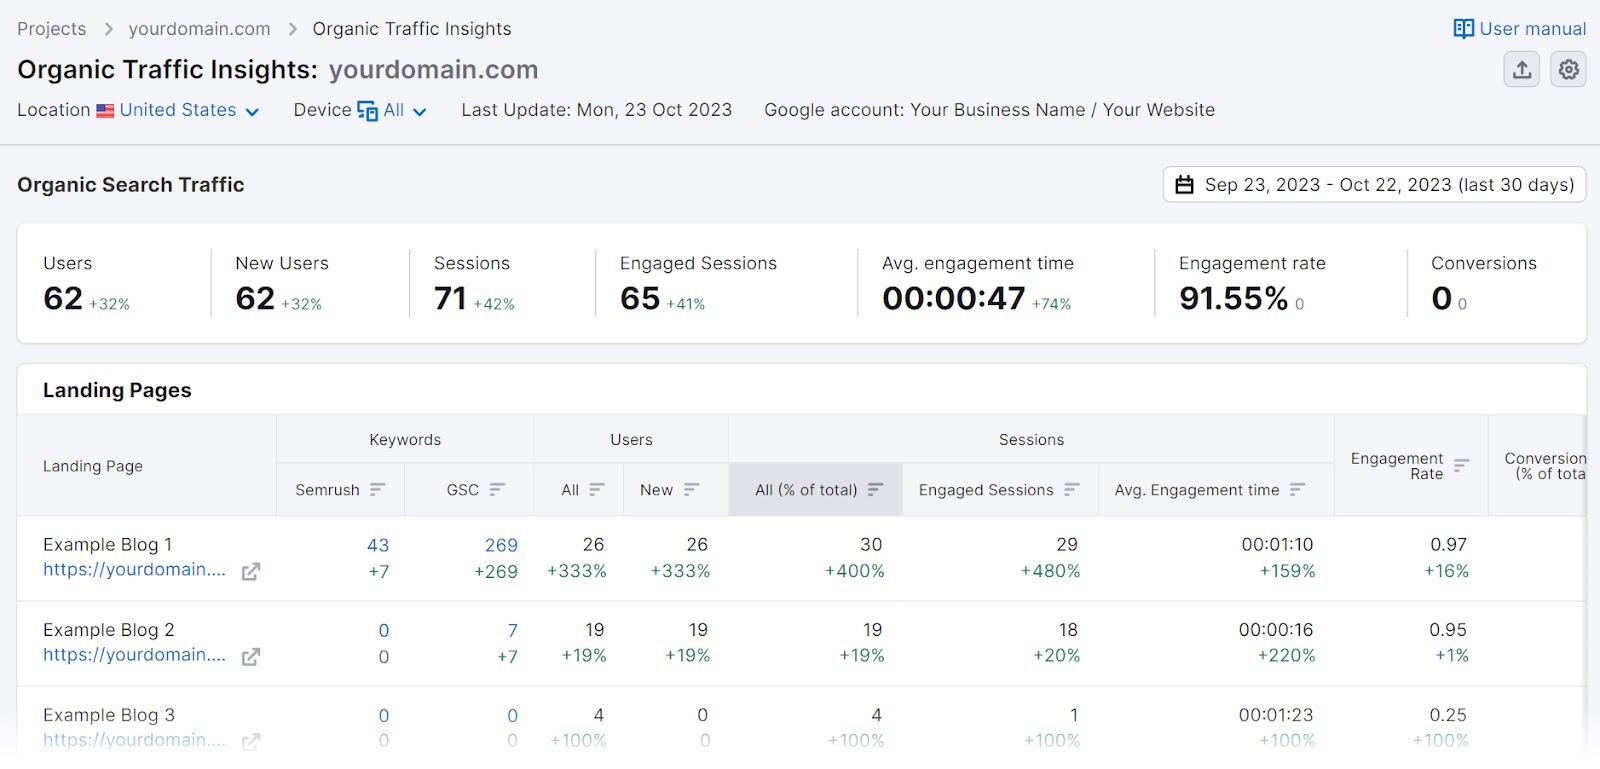
GA4 and Semrush are a perfect match for anyone who wants to track their performance and stay ahead of the game.
