What Is Page Speed?
Page speed (also called “load speed”) measures how fast the content of a page loads.
But it’s important to clarify:
“Page speed” is not a single metric.
Content loads in different stages. Which is why page speed is an umbrella term for the many ways to measure how quickly content appears on a page. Like:
- Time to First Byte (TTFB): How long it takes for the page to begin loading
- First Contentful Paint (FCP): How long it takes for the user to see the first element of a page (like an image)
- First Input Delay (FID): How long it takes for your site to respond to a user input (like a button click)
- Onload time: How long it takes to fully load the content of a page
Sometimes, the first thing a user sees is a blank page. Then, some elements appear. And finally, the full page loads.

Page speed metrics measure each of these events separately. To help you understand how fast your page is. And how fast it should be based on Google’s thresholds.
Keep reading to discover how page speed affects SEO and ways to improve it.
Why Is Page Speed Important for SEO?
Page load speed is a confirmed ranking factor on desktop and mobile. In fact, Google says extremely slow pages are less likely to rank high.
Which means Google algorithms take page speed (and other signals) into account when deciding how to rank your site.
Google cares how fast your page is because slow sites make for a poor user experience.
In fact, a user is three times more likely to bounce (i.e., leave your page) if your page takes longer than three seconds to load, according to Google.

They recommend making sure all your pages reach the "Good" thresholds for key page speed metrics.
How to Check Your Page Load Time
Here are two of the best tools to check your page load time. And how to use them.
Google PageSpeed Insights
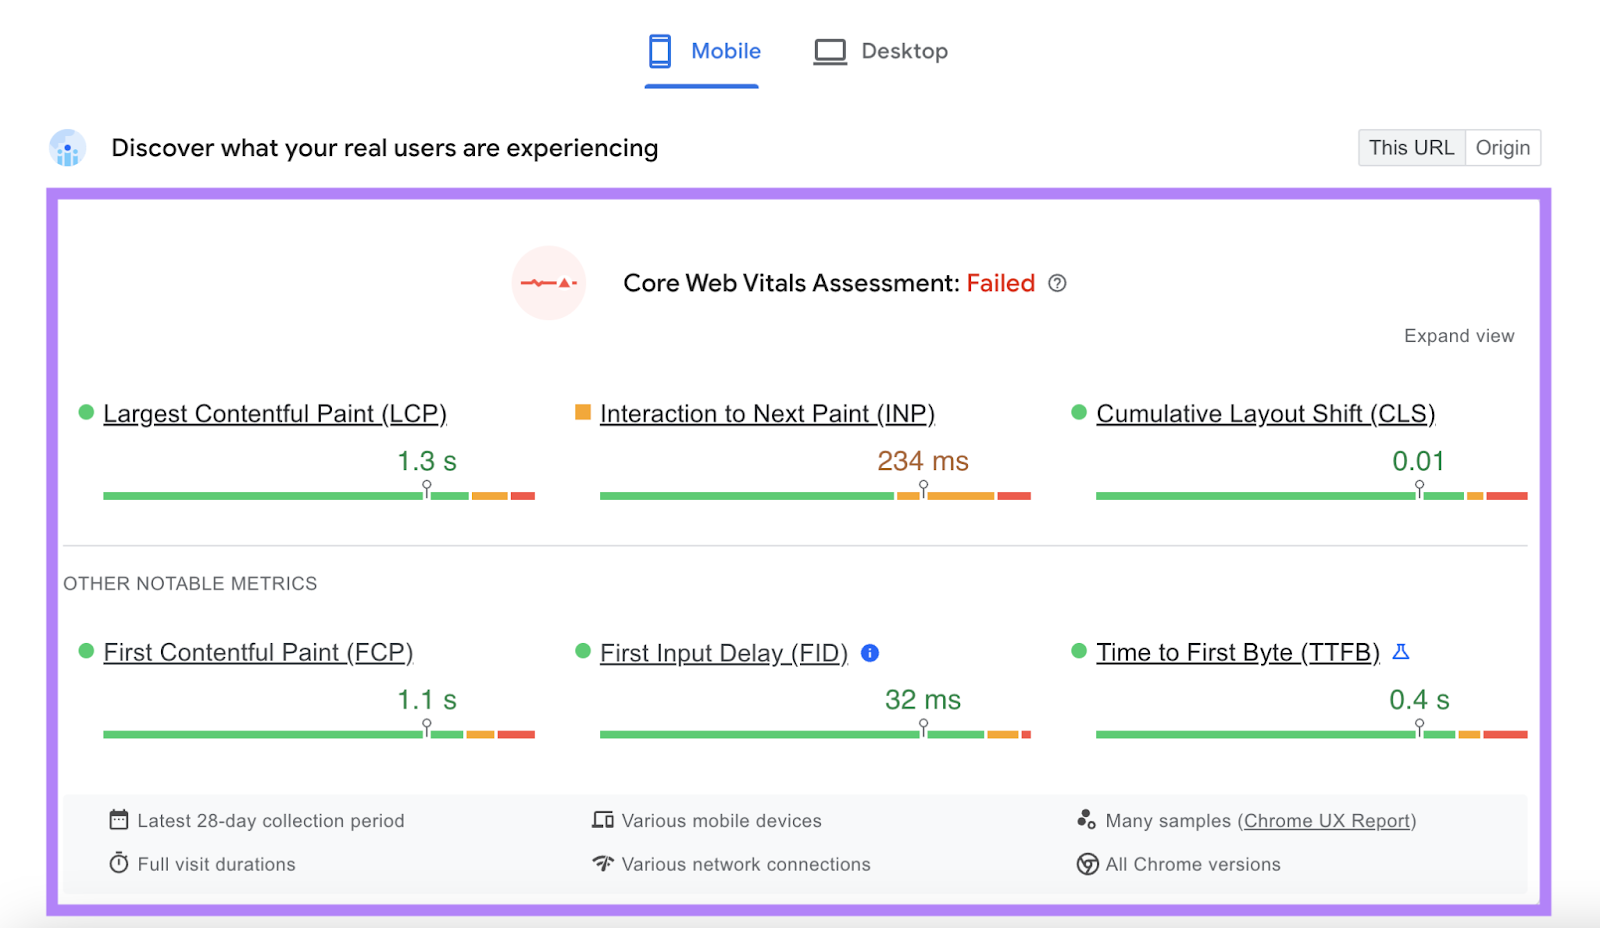
Google PageSpeed Insights (PSI) is a free tool that measures a webpage’s performance.
In addition to page load time, you can use PSI to measure Core Web Vitals (i.e., three important user experience metrics), view performance data, and get recommendations for improving your site.
To begin, open the tool. And paste the URL of the page you want to analyze into the search bar.
Then, hit “Analyze.”

At the top of the report, you’ll see an overall assessment of page performance: “Passed” or “Failed.”
Along with Core Web Vital metrics. And other important page speed metrics like FCP, TTFB, and FID.
Semrush Site Audit
Use Semrush’s Site Audit tool to check the page speed and web performance for all your pages. Not just one.
Site Audit includes over 140 on-page and technical SEO checks. Which makes it one of the most useful website auditing tools out there.
To get started, open the tool, enter your URL in the search bar, and click “Start Audit.”

Then, configure your Site Audit. And click “Start Site Audit.”

You’ll see a dashboard similar to this one:
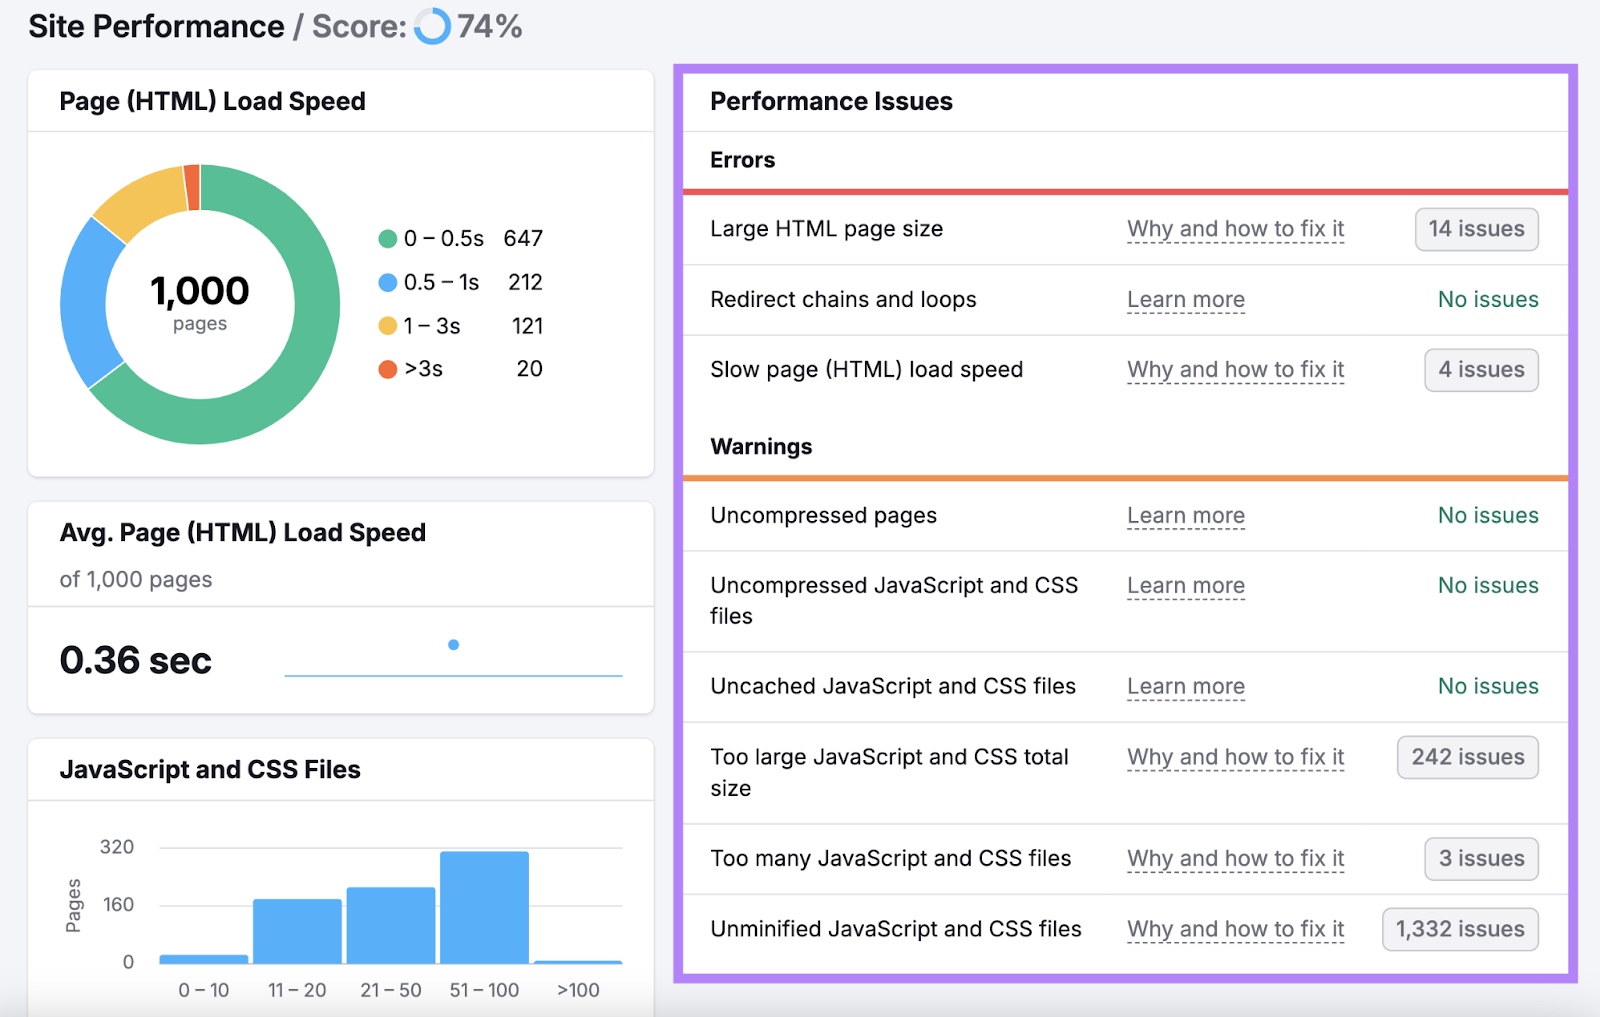
Click on “View details” under “Site Performance.” To check your load speed, performance issues, and more.

Take note of the “Page (HTML) Load Speed” and “Avg. Page (HTML) Load Speed” sections. To see how quickly your pages load, measured in seconds.

You’ll also see a list of “Performance Issues.” When fixing these issues, prioritize “Errors.” Then, move on to “Warnings.”
8 Ways to Improve Your Page Speed SEO
When you analyze your page (or site) with a page speed tool, you’ll receive many recommendations for improving its performance.
Let’s go through the eight most effective ways to speed up your pages.
1. Choose the Right Image Format
Different types of images require different image file formats.
Some formats are lighter than others because they offer higher compression levels. Choose the right format for each image to lower your page’s load time.
Here are the most common formats and how to use them:
- JPEG: Good for real-world images, like photographs
- PNG: Good for screenshots, designs, logos, or images with a higher level of detail
- GIFs: Avoid this format, as it will slow down your page. If you need an animated image, consider converting your GIF into a video.
- WebP: Good for all types of images because it’s lighter than JPEG and PNG (up to three times smaller, in fact). However, not every browser supports WebP images yet. So we’d recommend using JPEG and PNG for now.
2. Compress Your Images
Images often contribute to slow pages. Image SEO is a key part of website speed optimization.
Your goal should be to keep images as small as possible without compromising quality or user experience.
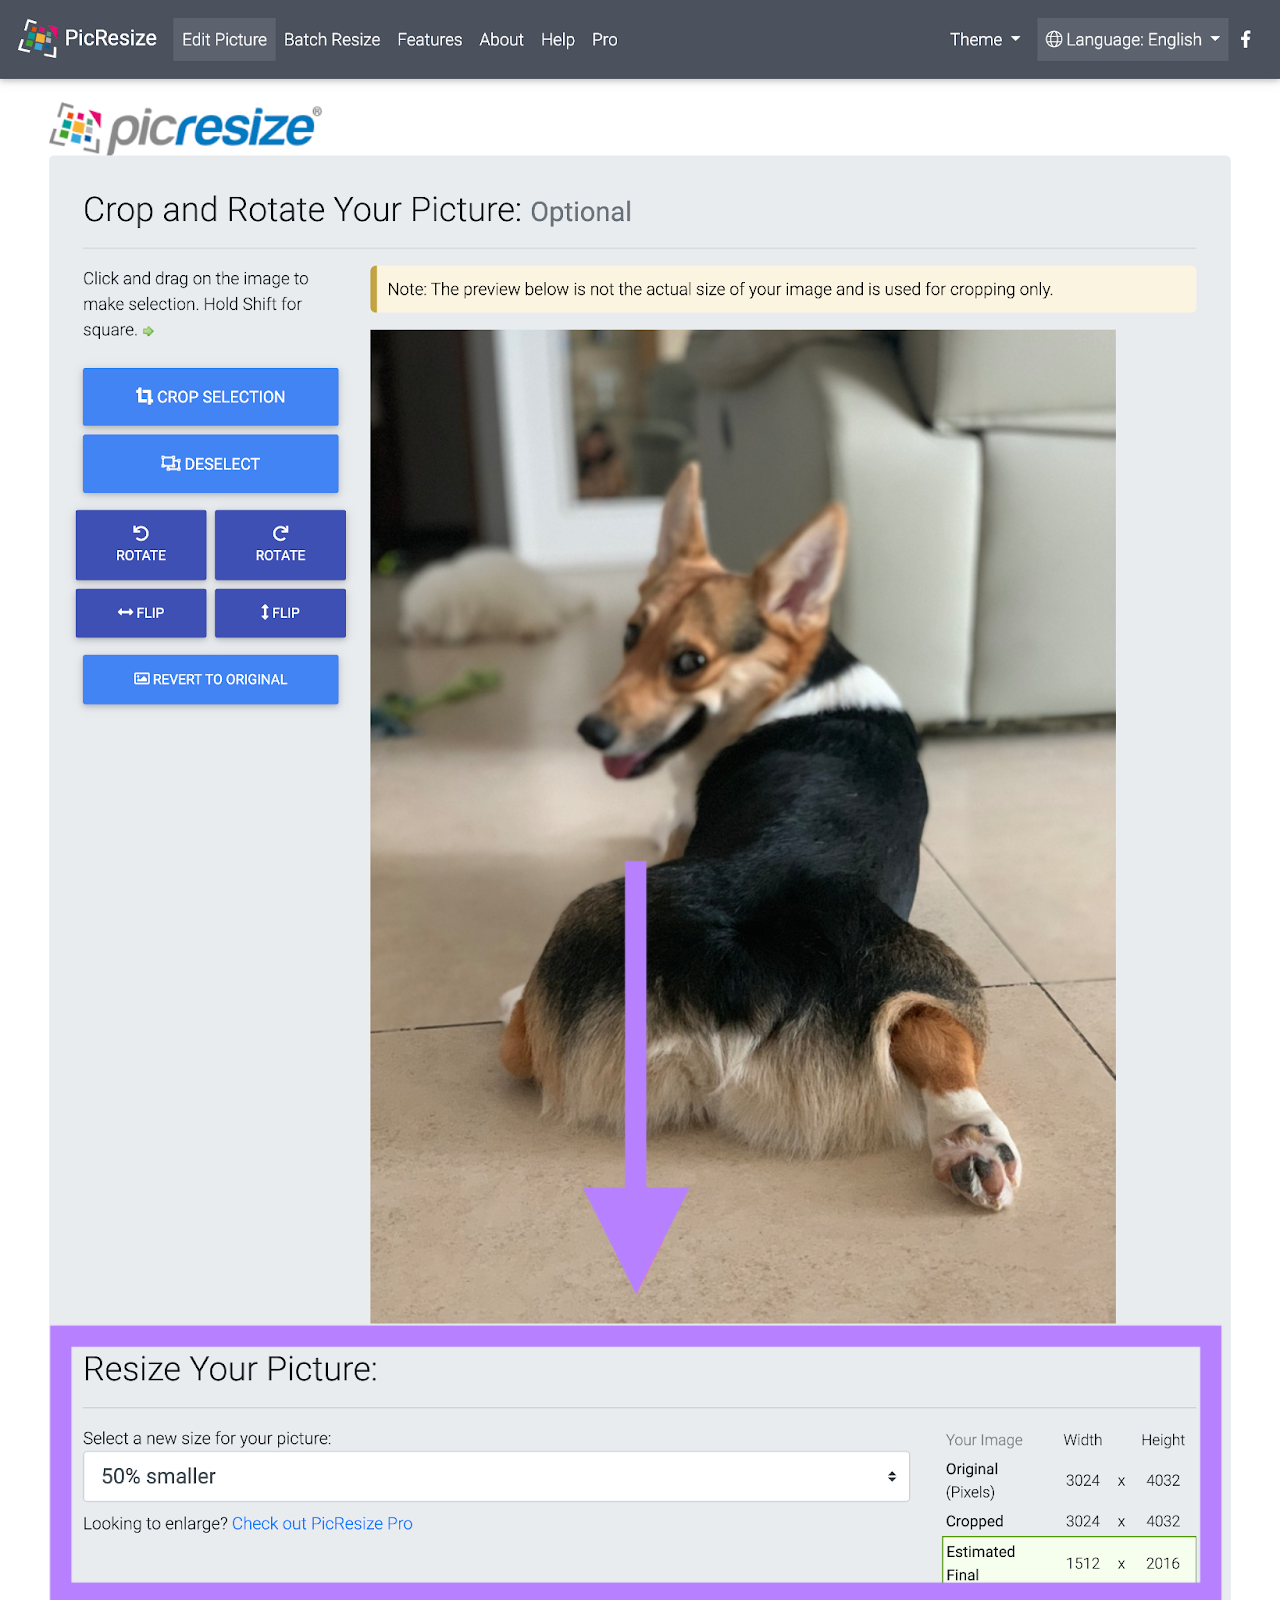
Say you want to upload an image that is 1MB and measures 3024 x 4032 pixels.
Resize your image using a free image resizer like PicResize.
Upload your image to the tool. And select how much smaller you want your image to become (e.g., 50% smaller).
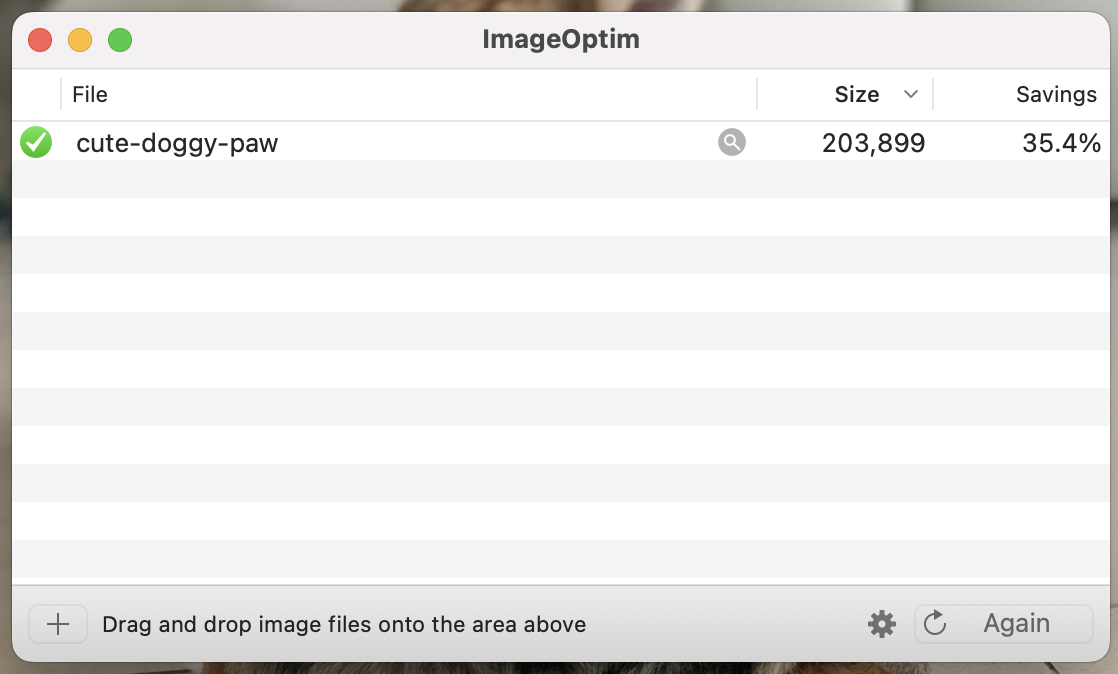
After you make your image as small as possible without compromising quality, use an image optimizer like ImageOptim to shrink it even further.
Simply run your image through the tool, and it’ll do its magic.
Always do this before you upload images to your site.
3. Enable Browser Caching
Browser caching is when a user’s browser temporarily stores webpage data. So, when the user returns to the page, it loads faster.
The first time a user enters your page, their browser stores elements like images or CSS files. That way, the browser doesn’t need to send as many requests when the user returns.
This improves the experience of returning users. But it won’t make a difference for users entering your site for the first time.
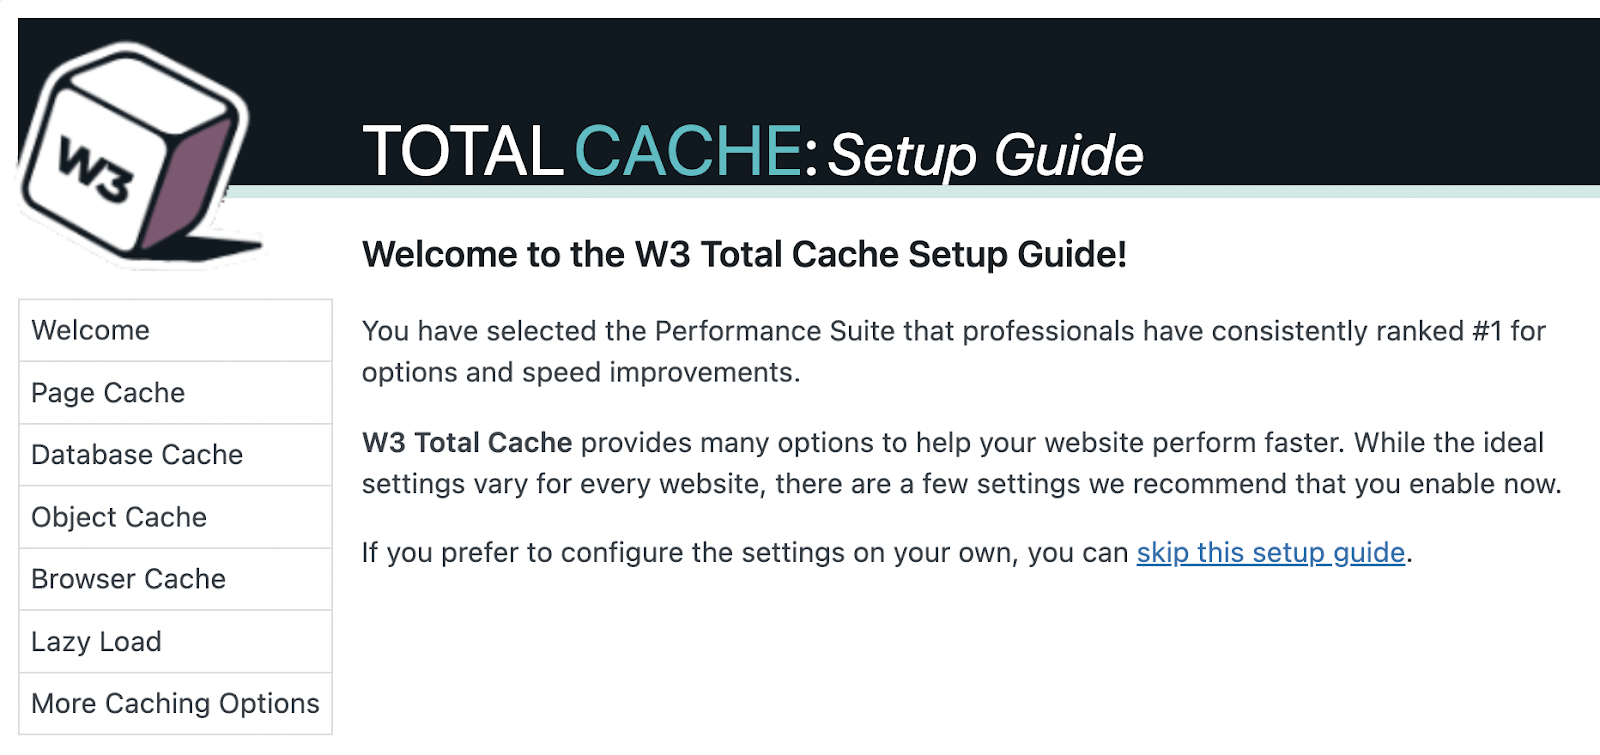
To enable browser caching on a WordPress site, use plugins like W3 Total Cache or WP Rocket.
4. Minify JavaScript, CSS, and HTML
Minifying JavaScript, CSS, and HTML reduces file size. Which can improve your page speed.
It removes line breaks, white space, and other unnecessary elements in the code. So computers can read it faster.
This is what standard CSS code looks like:
body {
font: 36px Arial, sans-serif;
}
/* Main container */
#container {
color: white;
background: #ffbd17;
width: 630px;
height: 160px;
display: flex;
justify-content: center;
align-items: center;
}
/* Content */
#content {
background: #333;
flex: 0 0 10px;
}
And this is what it looks like after minification:
body{font:36px
Arial,sans-serif}#container{color:#fff;background:#ffbd17;width:630px;
height:160px;display:flex;justify-content:center;align-items:center}
#content{background:#333;flex:0 0 10px}
How do you know if minification is necessary?
Semrush’s Site Audit tool flags pages on your site with unminified JavaScript and CSS files.

Once you know which pages are affected, it’s time to take action.
You can use an online minifier tool to minify your files. Or, if you own a WordPress website, a plugin like WP Rocket can help you minify your code.
5. Use a Content Delivery Network
A content delivery network (CDN) is a group of interconnected servers distributed across different locations. They bring your site “closer” to each user.
And pages load faster for users who are geographically close to the location of the main site’s server.
A CDN works like this:
- You cache your site on a CDN
- A user sends a request to open your site
- The server that’s closest to the user delivers the site
Say your origin server is in Los Angeles.
If a user in Italy tries to access your site, your CDN will find the closest server in the user’s network. (Let’s say it’s in France.) The CDN will then deliver a cached version of your site to the server in France.
Since Italy is much closer to France than to Los Angeles, your website loading speed will improve.

Good examples of CDNs are Cloudflare and Jetpack.
6. Improve Your Server Response Time
Slow server response times can significantly delay page loading.
When a user tries to access a webpage, the browser makes a request to fetch that content. The server receives the request and loads the page content.
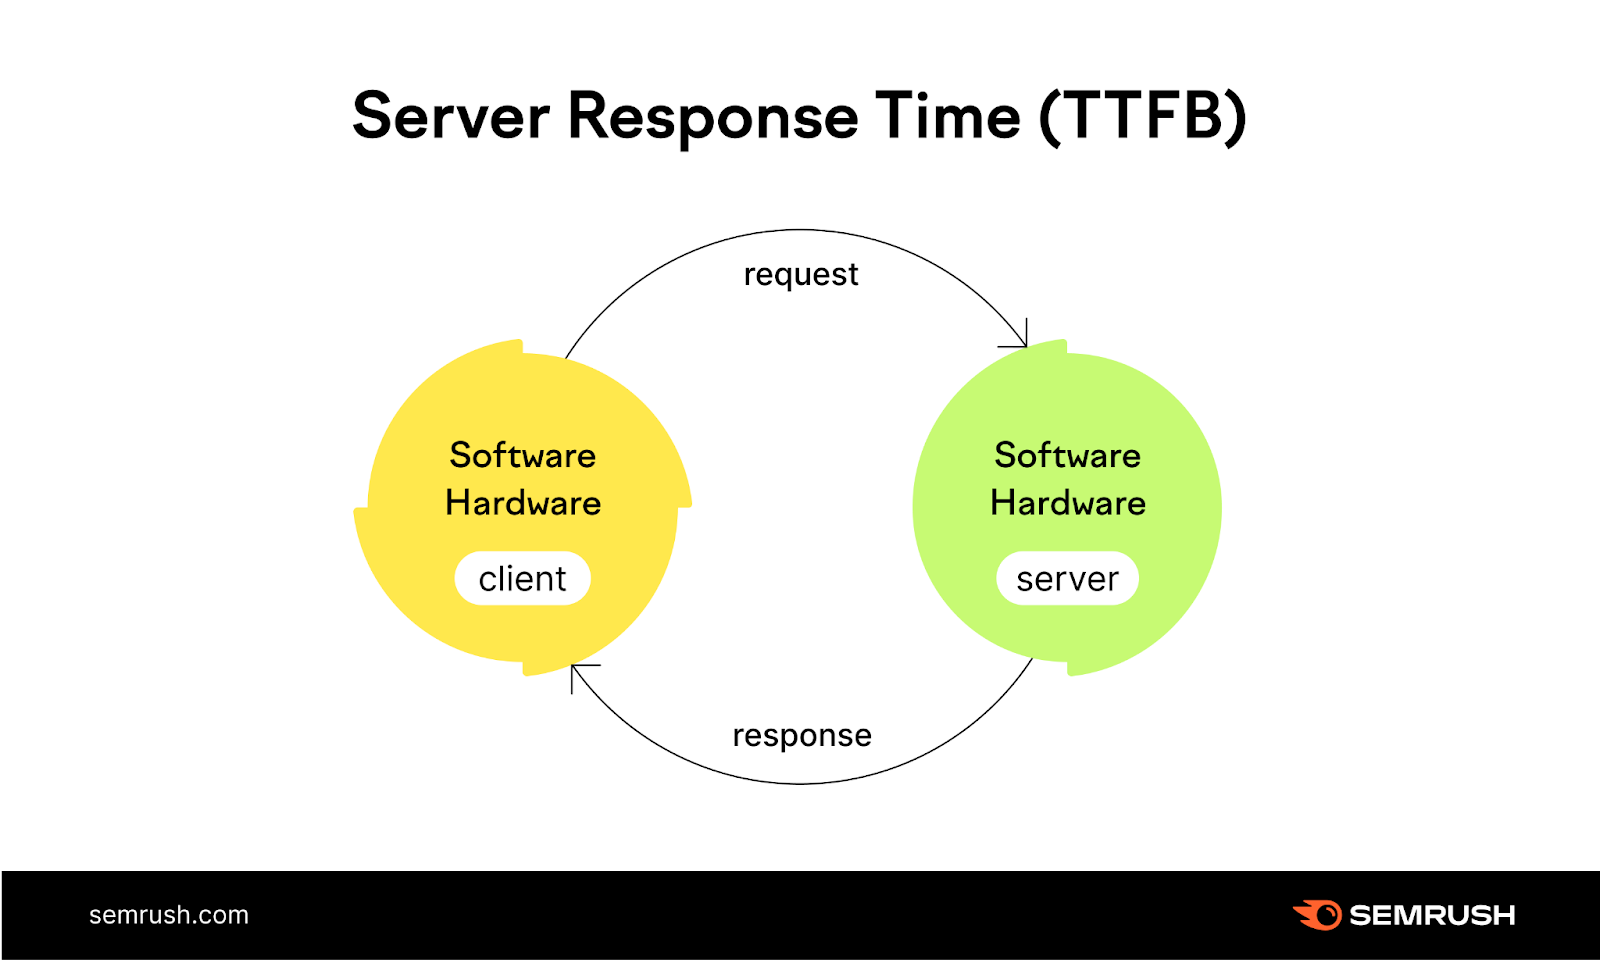
To improve server response time, consider upgrading your hosting plan. Shared hosting is often slower than dedicated or VPS hosting. If you're experiencing consistent slowdowns, it might be time to switch to a more robust hosting solution.
A few more things you can try include the following:
- Optimize your server’s application logic and configuration
- Index database tables or upgrade to a faster database system
- Add more random-access memory (RAM) and faster processors
You will likely need to consult with your hosting provider or a developer to implement these changes.
7. Reduce Redirects
Redirects can slow down your page load time.
A redirect occurs when a user clicks on one URL but is automatically sent to a different URL.
Let’s say a page's URL changes from "techblog.com/best-smartphones-2023" to "techblog.com/best-smartphones-2024." The redirect automatically sends users to the new page.
In some cases, a page might redirect several times before reaching the final destination. This is known as a redirect chain.
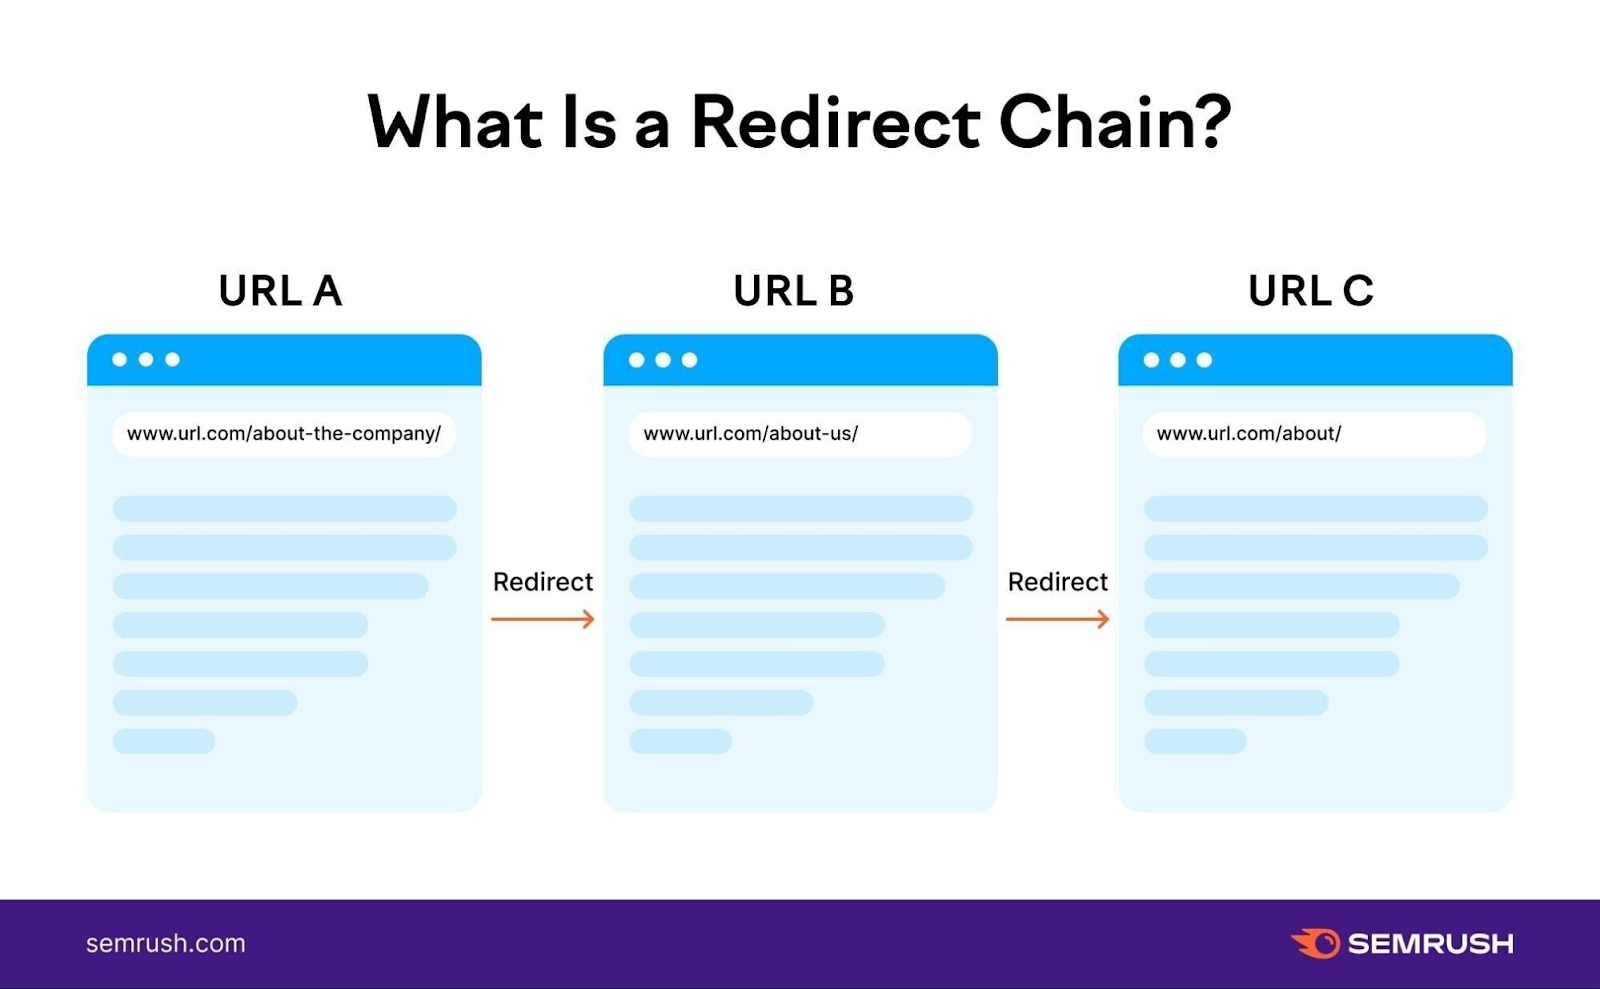
Every redirect adds an extra step in loading a page. Which makes the overall process slower.
To audit your site for unnecessary redirects, use the Site Audit tool.
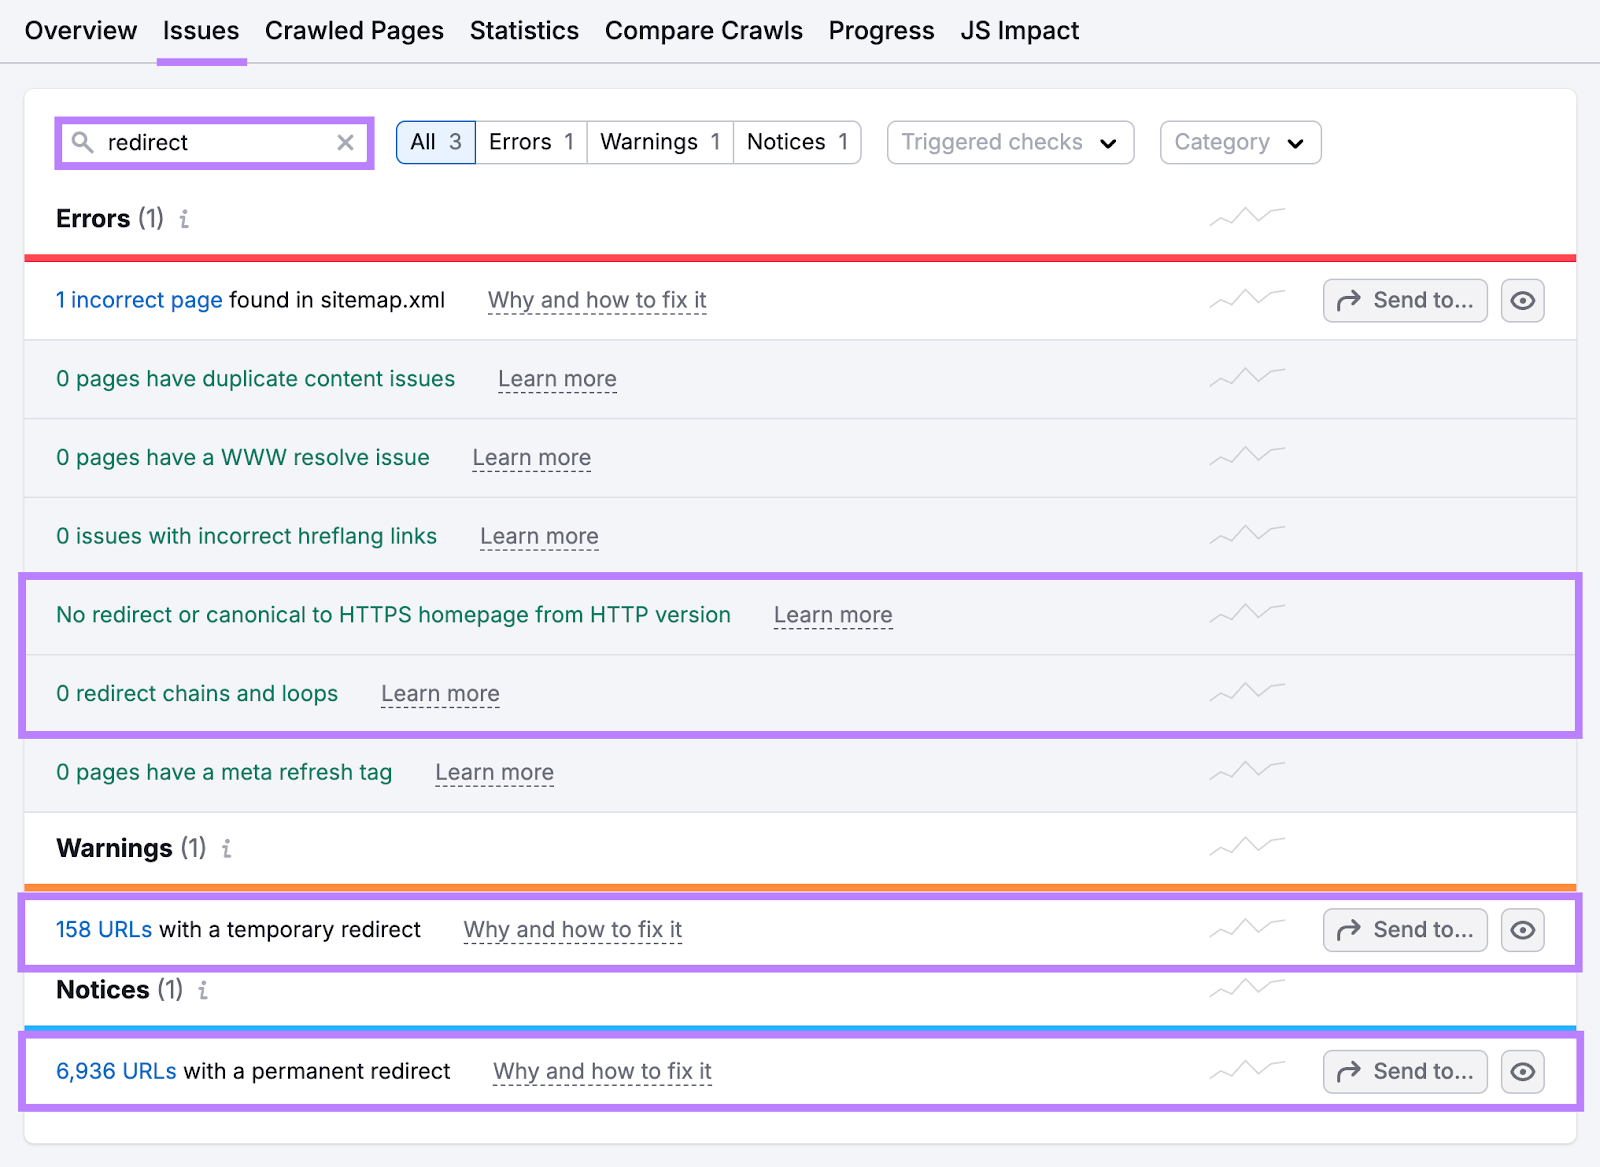
Go to the “Issues” tab. Type “redirect” into the search bar provided.
You’ll see a list of Errors, Warnings, and Issues related to redirects. Like:
- How many redirect chains and loops you have
- How many temporary redirects you have
- How many permanent redirects you have
Click on the link within each identified redirect error to see the list of affected pages.
The report will show each page’s redirect type and number of redirects:

If you’ve identified any redirect chains or loops, the next step is to delete the unnecessary redirects.
8. Reduce HTTP Requests
HTTP requests happen when web browsers send “requests” to a website’s server for more information.
Say a user visits a page. The server gets a request from the browser and answers with a file containing information the user needs to view the page. (This file could contain text, images, multimedia, etc.) The user can’t view what’s in the file until the request is complete.
But if that file doesn’t contain all the information the user needs to view the page, the browser will send another request.
The more requests, the more your page speed slows down. The user will have to wait longer to view the entire page.
Aim to reduce HTTP requests (or to make them load faster) to improve your page speed.
To view a page’s number of HTTP requests, use Google Chrome.
Open your page on Chrome. Right-click anywhere on the page and choose “Inspect.”

You’ll see Google’s developer tools (also called Chrome DevTools). Go to the “Network” tab.
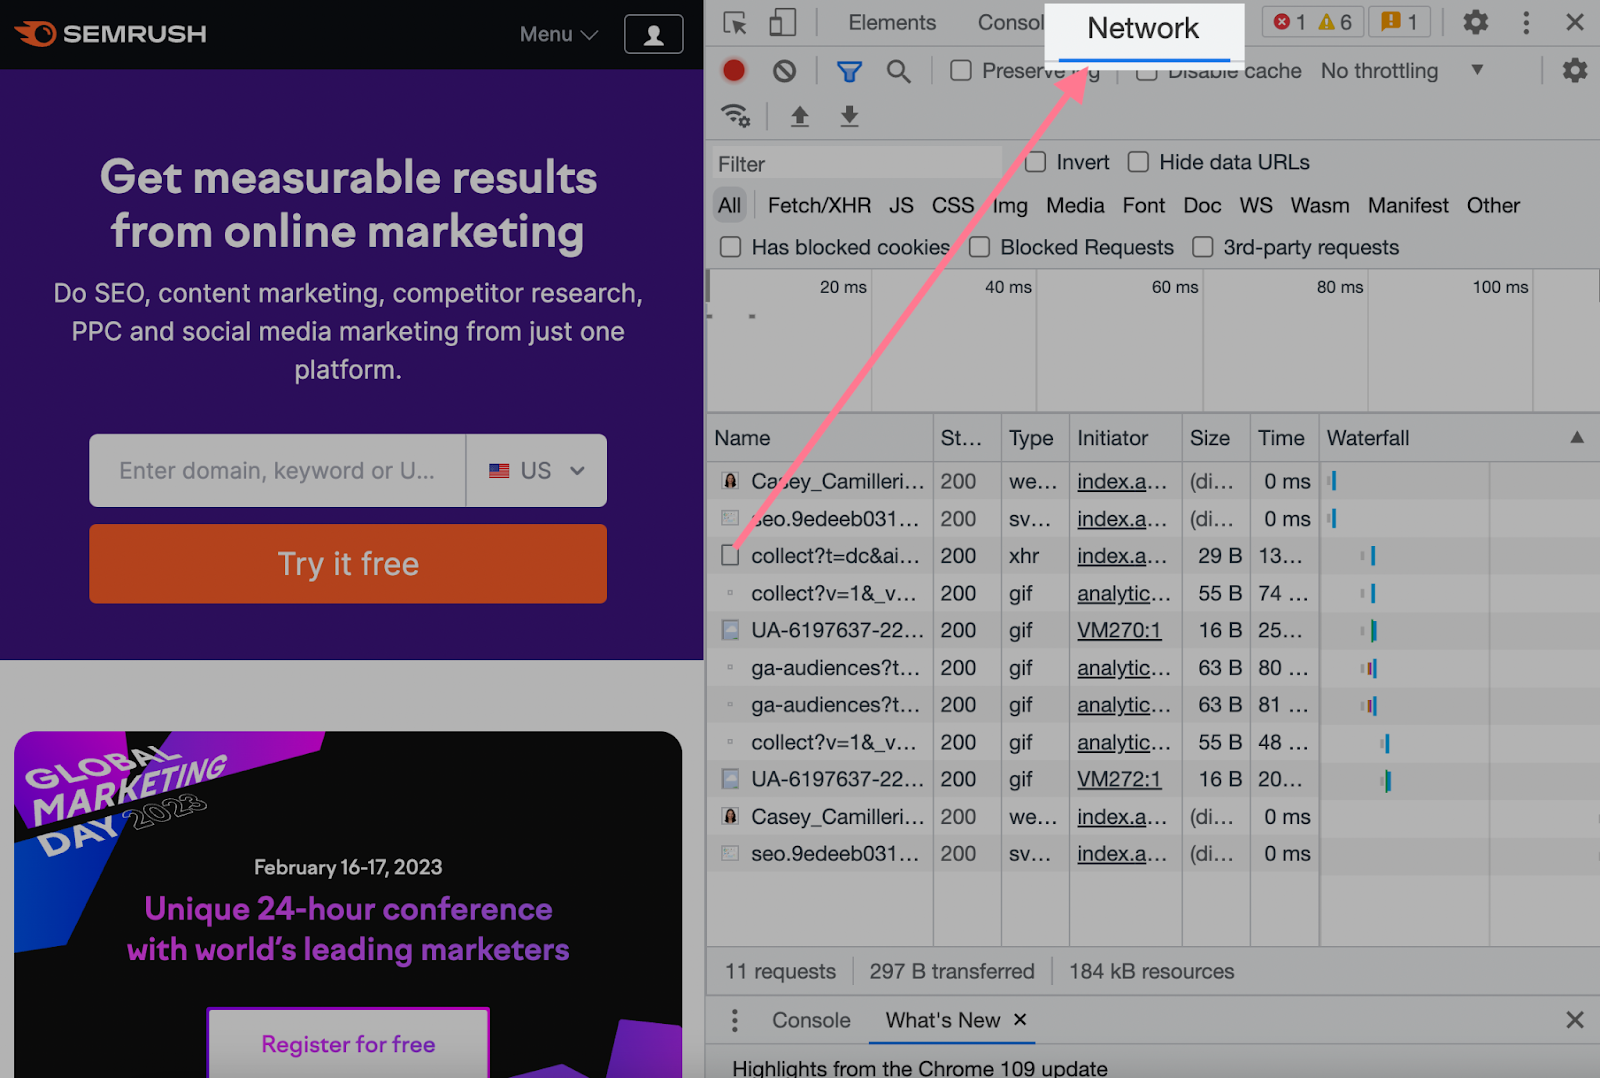
At first, the panel will have few to zero entries. Reload the page to collect data.
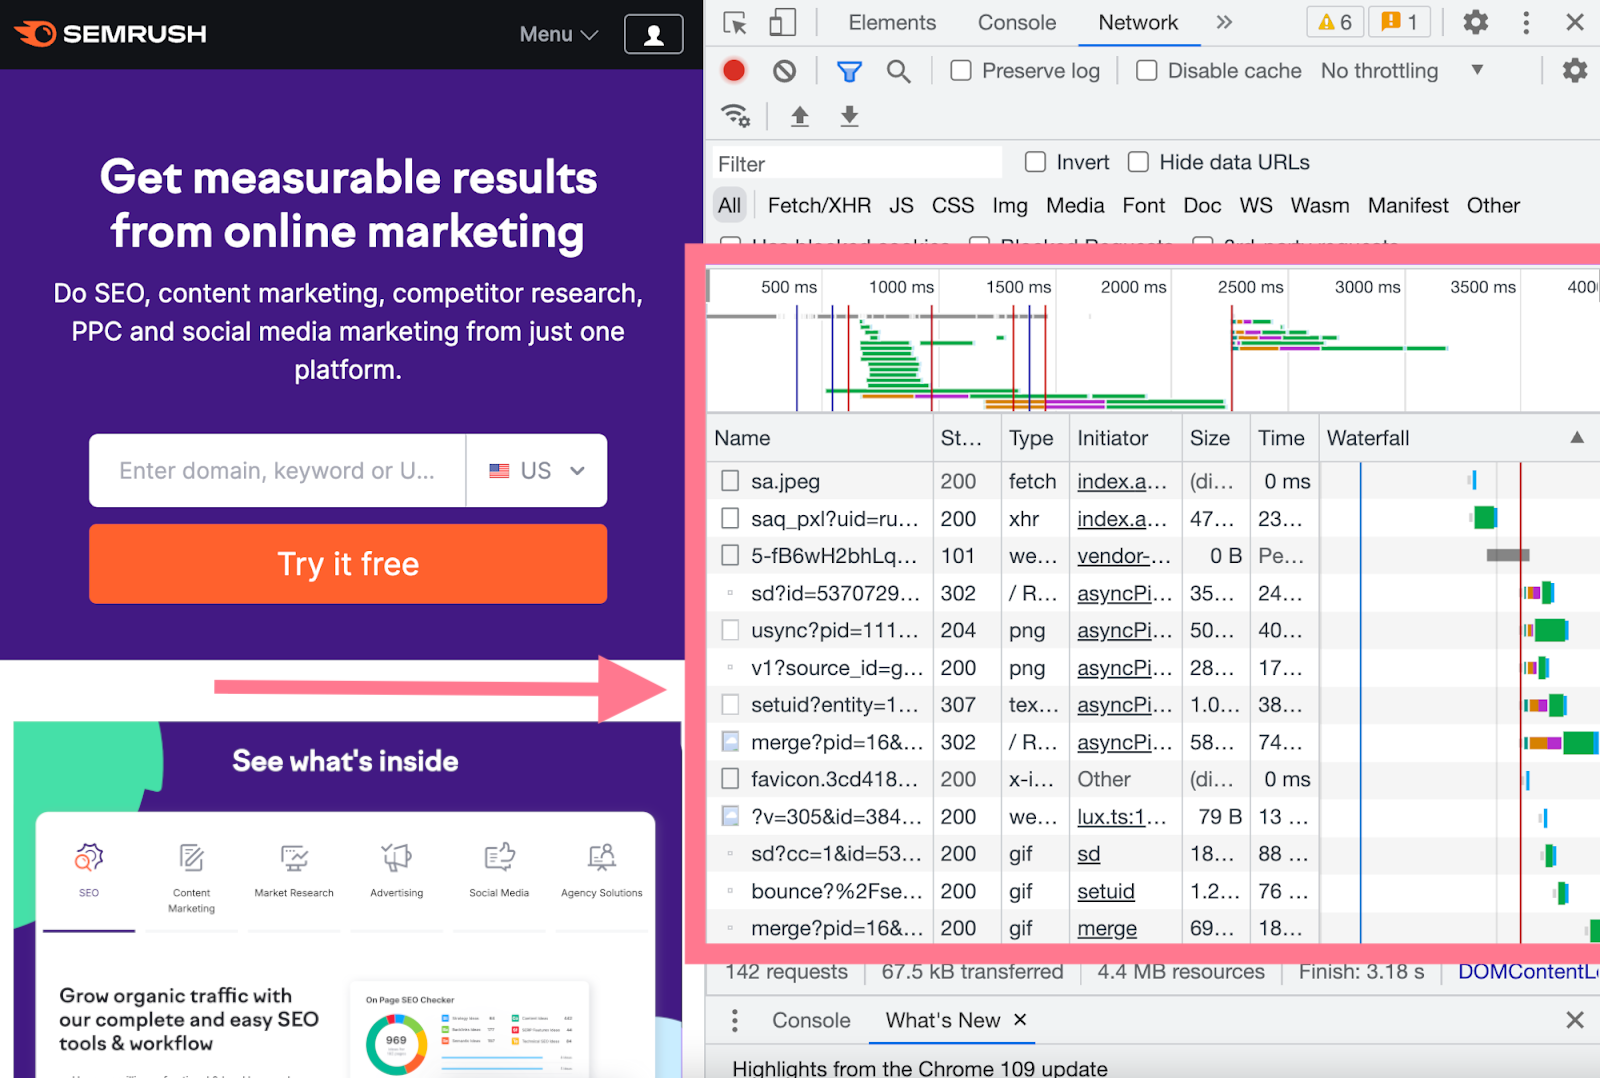
You’ll see all HTTP requests, their sizes, and the time it takes to load them. These include requests for images, plugins, JavaScript or CSS files, and many more.
You can also see the total number of requests in the bottom-left corner of the inspect window.
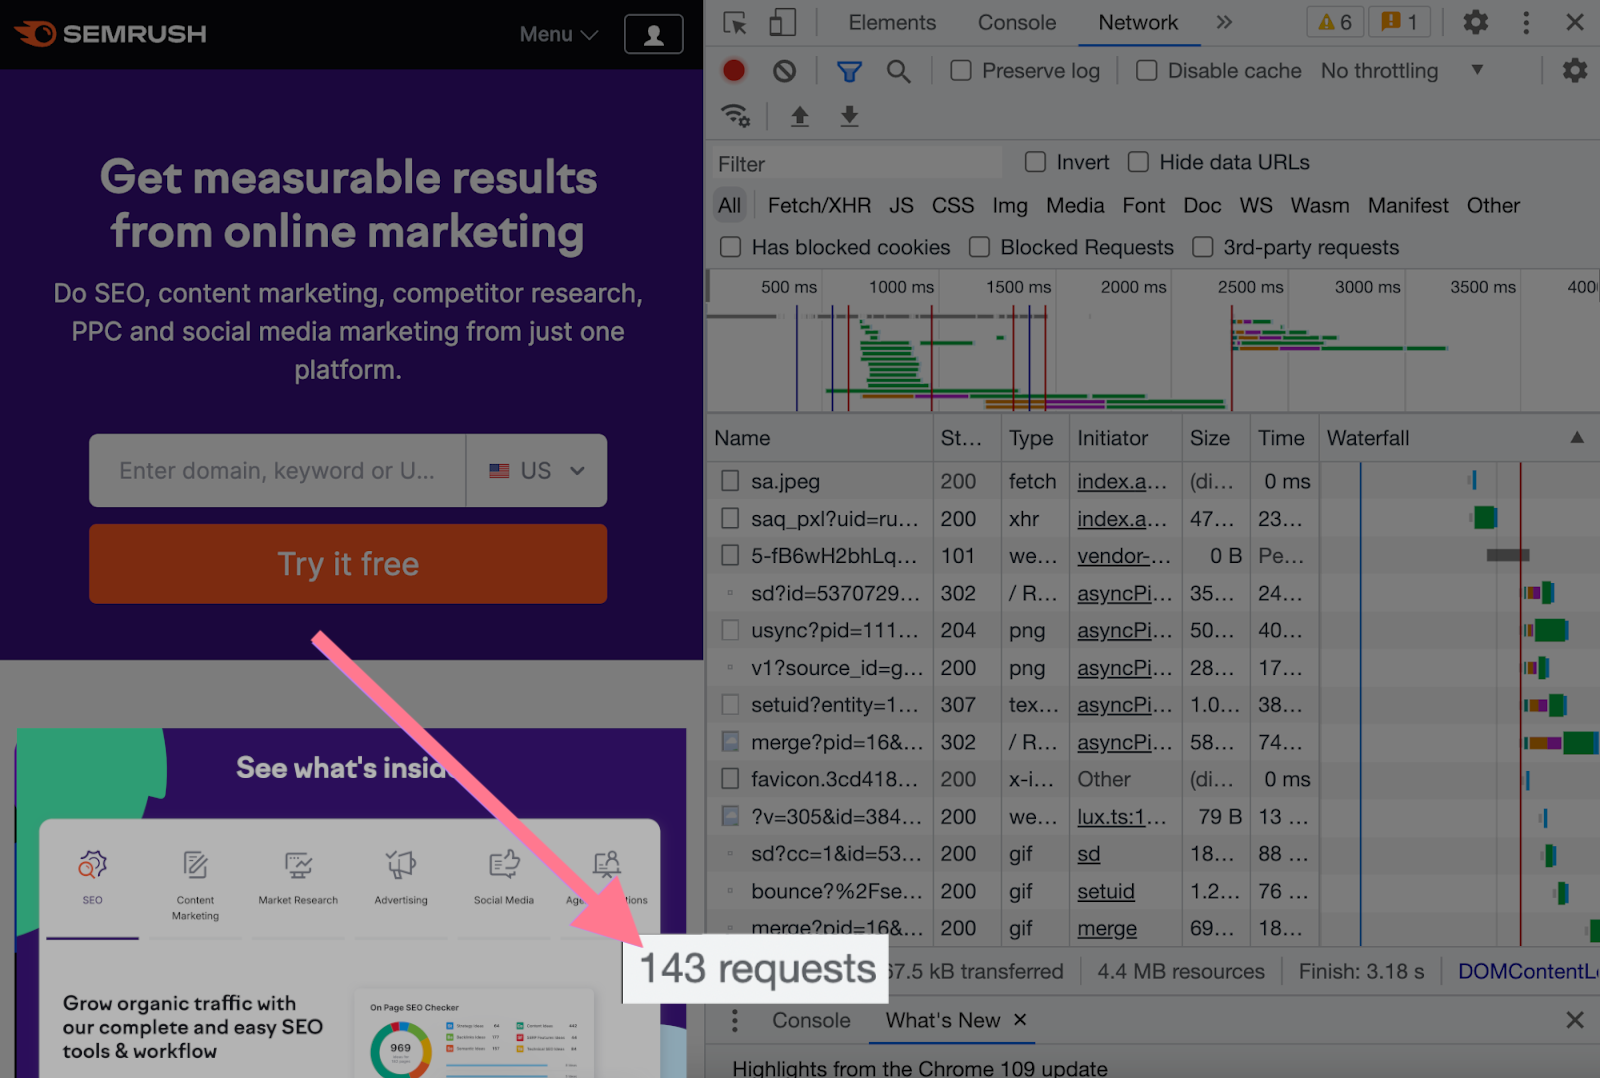
This number is a good way to track your progress. The fewer requests, the better.
For context, the average page sends around 70 HTTP requests. However, there isn’t a specific number to aim for. Use the average number of requests on your webpages as guidance to track your progress.
Optimize Your Technical SEO
Page speed is just one piece of the technical SEO puzzle. But it's a crucial one for improving both search rankings and user experience.
To get a comprehensive view of your site's technical health, including page speed insights, try the Semrush Site Audit tool.
It provides a detailed analysis of your website's performance and offers actionable recommendations for improvement.
Start optimizing your site today with a free site audit. And take the first step toward better rankings and happier users.
