Mobile App Insights is an app created by Mobile Action. It is a set of tools to help you analyze and optimize your mobile app performance. It can be found in the Semrush App Center.
How Can Mobile App Insights Help Me?
Here are a few ways Mobile App Insights might help you:
- Track the performance of up to 40 mobile apps.
- Find and target high-impact keywords
- Analyze search performance over time
- Analyze and improve your app’s visibility score
- Optimize your paid search ad strategy
- Analyze the performance of competitive apps in your category
Pricing
A subscription for Mobile App Insights is $59/month.
More information about pricing can be found here.
What Is Included In Mobile App Insights?
The tools included in Mobile App Insights are broken out into four tabs: App Profile, ASO Keywords, Category Rankings, and Search Ads Intelligence.
Each tab includes a header that allows you to toggle between the apps you are tracking, called Watched Apps, and the country being viewed. The header also includes basic information about the app:
- Publisher
- Category
- App Store
- IAP (In App Purchases)
- Price
- Visibility Score
- Downloads
- Revenue
App Profile
The App Profile is the first screen you see when you enter the app. It acts as a dashboard to show you basic information about your app and its performance.
Some information, such as metadata, publisher descriptions, and screenshots of the app on various devices, is pulled directly from the app’s page in either the Apple App Store or Google Play.
Important information found on the App Profile:
- Category Performance: This is a visualization of your app’s performance over the past 90 days. More information about this can be found in the Category Rankings tab.
- Keywords by Download: This list tells you the estimated percentage of organic downloads generated by each keyword, plus other information about your search performance in the app store, the amount of competition, and your Chance Score.
- Search Ads: This is a short list of keywords you are bidding on, plus your share of impressions versus your competitors for each keyword.
- Audience Geography: shows the locations of the apps' visitors.
ASO Keywords
The second tab, ASO Keywords, allows you to find and track keywords you are interested in, as well as the keywords of any competitors you have added. ASO stands for App Store Optimization.
All of the keywords you choose to track will be added to the Keyword List at the bottom of the ASO Keywords page. You may track up to 400 keywords in total across all of your Watched Apps. The Keyword List also provides relevant information about all of your selected keywords, including:
- Brand Keywords: A keyword directly related to the branding of an app, usually containing the name of the app
- If there are any Search Ads on this keyword
- Search Score
- Difficulty Score
- Total number of apps ranking for that keyword
- Your app’s rank
- Related keywords
- Whichever color you have assigned to that keyword, for sorting purposes
There are a few different ways to add keywords to the Keyword List.
If you already know which keywords you want to track, you can add them manually. Simply type all the keywords you want to track into the Add Keywords field at the top of the page, separated by commas, and click the blue Add Keywords button.

Mobile App Insights will also suggest keywords for you to track. These are broken down into a few categories, which are found in the menu on the left side of the page.
Click on the category you are interested in to view all of the suggestions. Any keyword you are not already tracking will have a plus sign next to it. Click on it to add that keyword to your Keyword List. If you’d like to add all of the suggested keywords in a category to your Keyword List, click on Track All on the right side of your screen.
Category Keywords will automatically suggest keywords that pertain to your app’s category. This would be something like Music, Social Media, Health & Fitness, etc.
Competitor’s Keywords helps you view and track keywords that your competitors are targeting. In order to use this category, you need to have added at least one competitor. Use the drop down menu above the suggested keywords field to toggle between competitors whose keywords you are viewing.

Keywords by Description pulls keywords from your app’s description. It also analyzes how many times that keyword was used in the description.
Keywords by Download helps you find and track more keywords based on the estimated percentage of downloads they bring to your app. You can also view the performance of your current tracked keywords by download on the App Profile tab.
Keyword Research helps you find related keywords. To use it, enter a keyword you like into the search field. Your search results will generate a list of relevant suggestions. Related keywords can also be found in the Keyword List.
Ranked Keywords helps you find keywords your app is already ranking for. Use the drop-down menu above the suggested keywords field to filter your results based on where your app ranks in the search results for that keyword. For example, you could choose to view only keywords where you are ranking #1, or only keywords where you are above 100.
To remove a keyword from your list, click on the trash bin icon in the correct row.

Keyword Groups
Efficiently organizing your keywords is crucial for effective analysis. Here’s a simple guide to help you group and manage your keywords using the Keyword Groups feature:
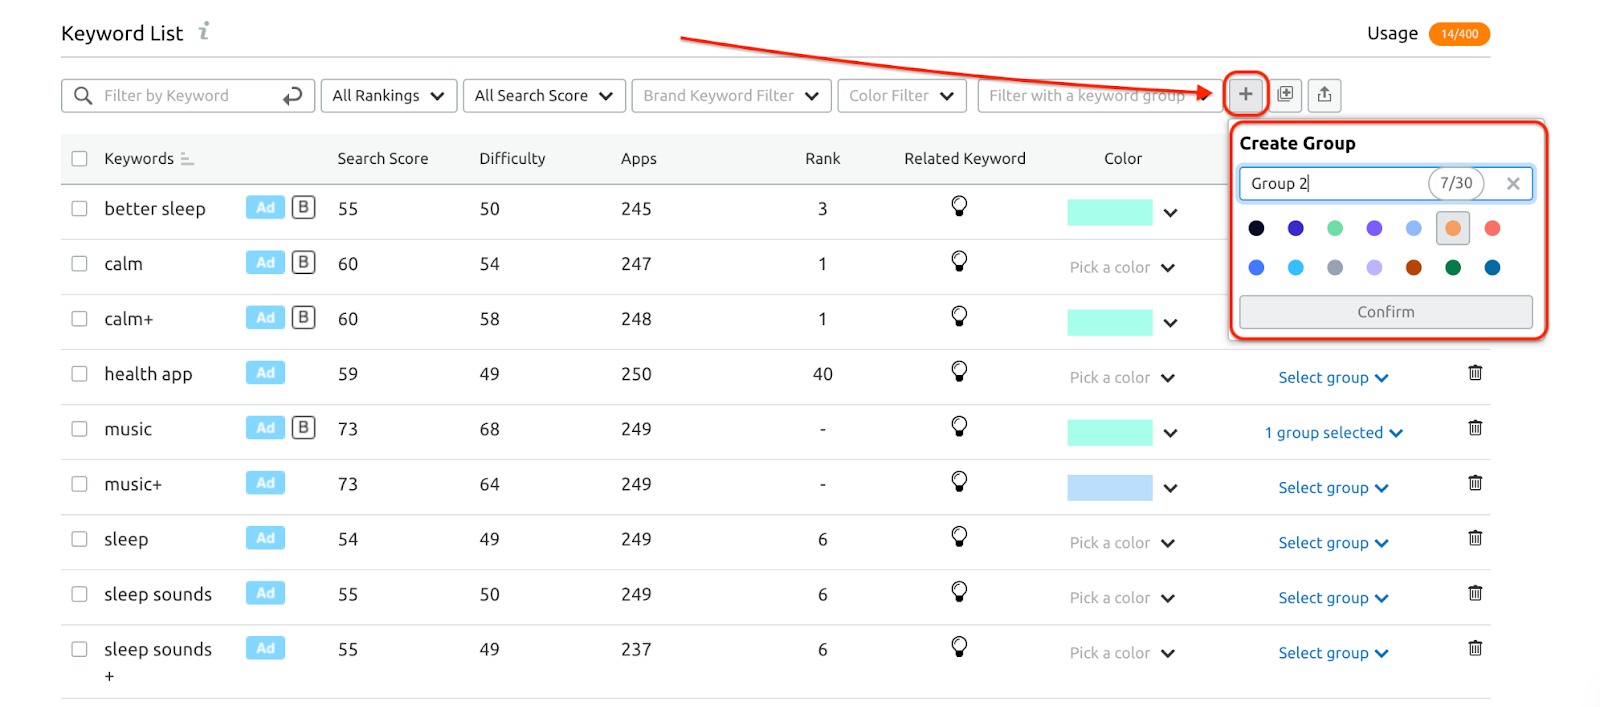
1. Create Keyword Groups: In the Keyword List section, navigate to filters and click the Plus button. A window will pop up – name your group, choose a color for easy identification, and hit Confirm. 
2. Add Keywords to Groups: Choose a keyword, click on ‘Select group’ to the right, find your desired group from the drop-down, and click Add.
Note: A keyword can belong to multiple groups, allowing flexibility.
3. Filter Your Keyword List: Simplify your keyword management by filtering the Keyword List based on specific groups. Click on 'Filter with a keyword group' in the filters section and select the desired group.
Category Rankings
The Category Rankings tab is a more detailed version of the Category Performance graph in the App Profile. On this tab, the header allows you to choose the date range for the data you want to look at. On the top row, all the way to the right, click on the calendar icon to choose the range you’re interested in.

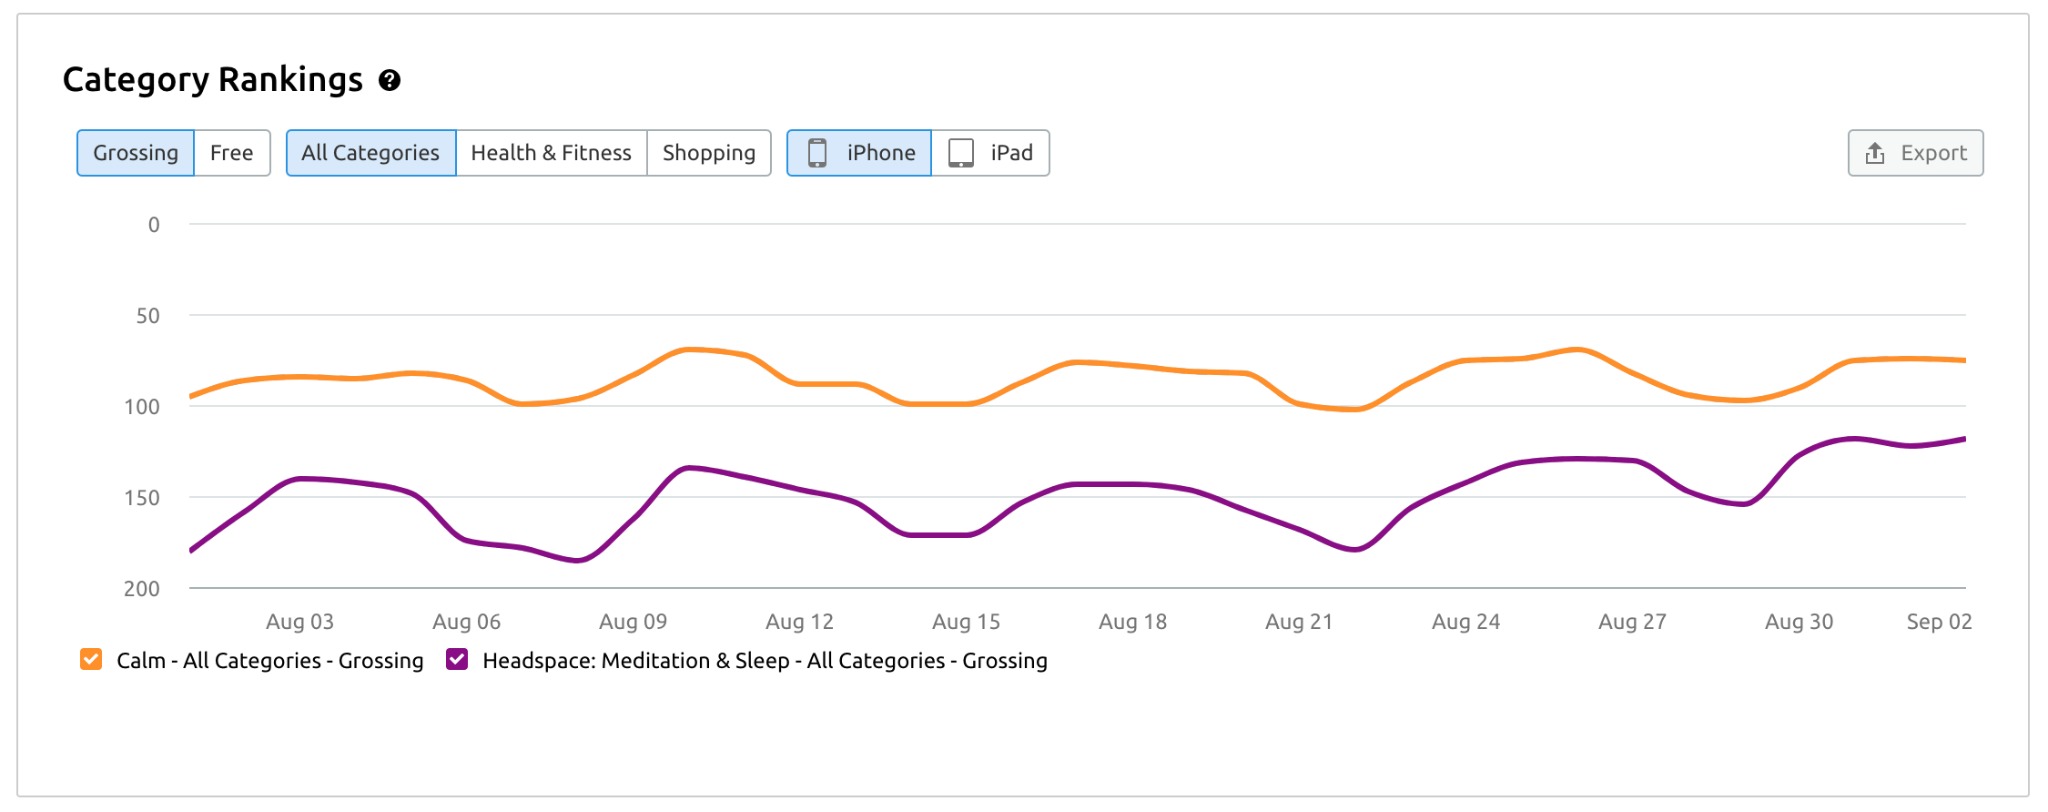
In the center of the page, you’ll find a line graph that looks similar to the Category Performance graph on the App Profile. The Category Rankings graph allows you to view not only your app’s performance in its category, but also your competitors’ performance, as long as that data is available.

At the top of your graph, you can toggle between a few different views:
- Grossing vs. Free
- All Categories vs. your specific category
- Device type (e.g. iPhone, iPad, etc.)
Click on the options you want, and the graph will automatically adjust.
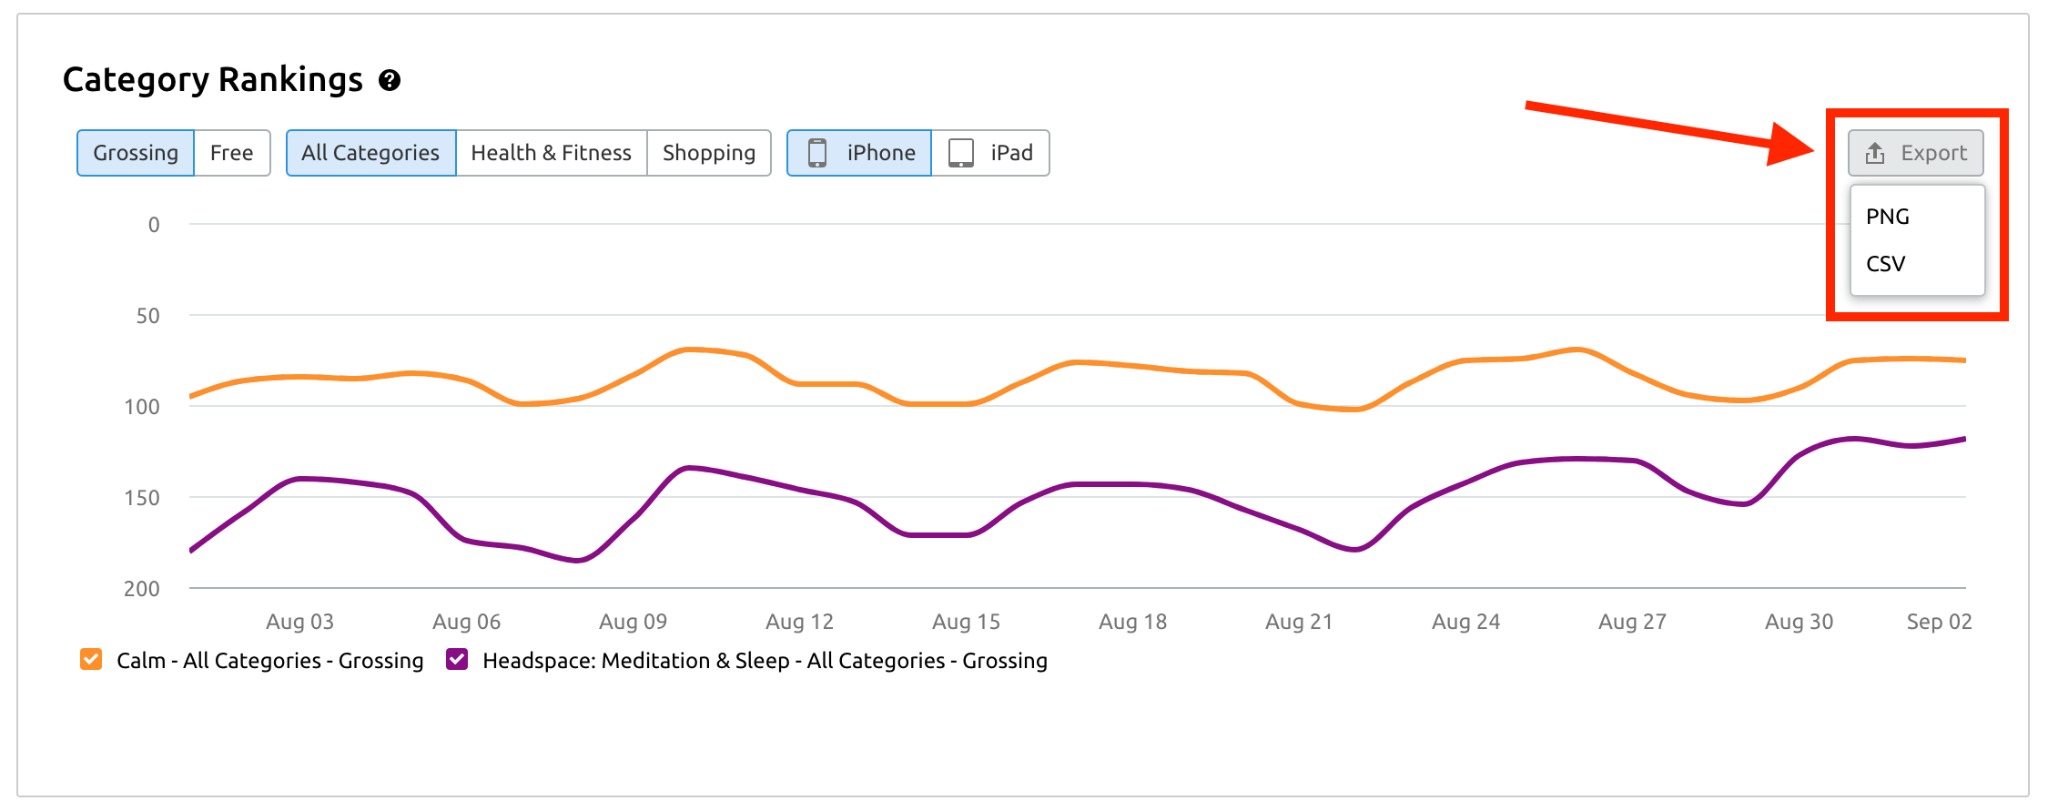
You can export the Category Rankings graph in PNG and CSV formats for the selected time period. The feature is available for both Apple App Store and Google Play.

Below the Category Rankings graph, you’ll find the Last Day Rankings chart. This chart shows your and your competitors’ performance overall and in your category over the last day. You can also compare Visibility Scores. If you’re not sure why one of your competitors is not appearing in the Category Rankings graph, it may be because the information is not yet available. Check this chart to see if any of the fields are still empty.

Search Ads Intelligence
The Search Ads Intelligence tab looks at the performance of all of your paid ads for any app using Apple Search Ads.
Similar to Category Rankings, the header has a few extra options. You’re able to choose the date you want to look at, and also toggle between the Search by App and Search by Keyword sections. Additionally, you have a new score: the Search Ads Visibility Score.

Search by App
Search by App is the default view when you enter the Search Ads Intelligence tab. Here, you’re able to view all of the keywords your app is bidding on, as well as your share of impressions for that keyword, compared to the Impression Share of other apps competing for that same keyword.

Up to four competitors for a keyword will be visible at a time. To view a complete list, click the See More icon. You will be directed to the Search by Keyword section with a search for that keyword automatically performed.
In addition to Impression Shares, you can also view your app’s organic search performance, and the Popularity Score of that keyword in the Apple App Store.
To add any keyword on this page to your Keyword List, click Track in the last column on the right. To add all of the keywords to your list, click Track All at the top of that column.
Search by Keyword
Search by Keyword allows you to view more detailed information about Search Ads performance and competition on a specific keyword. You can search for a keyword you’re interested in a few different ways.
First, you can click See More from the Search by App section to search for that keyword automatically. Second, you can use the search field at the top of the section to enter your keyword manually.
On this page, you may notice that the header looks a little different. It tells you:
- The Popularity Score for that keyword
- Your Chance Score
- The total apps that rank on that keyword
- The number of apps running ads on that keyword

Below that, all of the apps running ads on that keyword are listed. By default, they are listed in order of Impression Share, but you can change the order by clicking on any column header. In addition to Impression Share, this chart tells you organic search performance of each app for that keyword, the app’s Search Ads Visibility Score, the total number of paid keywords they are running ads on, and their category.
SearchAds Benchmarks
The SearchAds Benchmarks tab offers information about Apple Search Ads industry benchmarks. It gives you a clear idea of how apps in the Apple App Store performed on average in the previous month.
This data can help you improve your Apple Search Ads strategy, leading to better engagement and conversions on the App Store.
Overview widget
The Overview displays the monthly averages across apps in the App Store for the following metrics:
- Cost Per Acquisition (CPA)
- Cost Per Tap (CPT)
- Conversion Rate (CR)
- Tap Through Rate (TTR)

Here, you can also find information about the specific time period during which the data was collected.
Metrics By Category
The Metrics By Category is a table that breaks down TTR, CR, CPT, and CPA metrics for each app category in the App Store. It allows you to analyze and compare the performance of apps in different categories across all metrics at a glance.

The color visualization feature, with the color deepening or lightening based on metric values, helps you quickly identify categories with the highest and lowest values for each metric.
Conversion Rates and Tap Through Rates
These widgets focus on Conversion Rates (CR) and Tap Through Rates (TTR) metrics separately, providing a visual representation of category performance in the form of bar graphs.

By comparing these metrics across categories, you can identify trends and areas for optimization in your own Apple Search Ads campaign.
How Do I Find And Track An App?
Using Mobile App Insights, you can view data on an unlimited number of apps, as long as they are available in either the Apple App Store or Google Play. You can also track the performance of up to 40 apps using your Watchlist.
The first time you open Mobile App Insights, you will see a Welcome screen, which prompts you to set up the app by choosing the following:
- An app you want to add to your Watchlist
- A country whose data you want to look at (required)
- A competitor (optional)
- A keyword

Once you’re happy with your selections, click “Ready to go” to begin using Mobile App Insights. You will also be able to add more apps to your Watchlist, track more keywords, and add competitors later, using the app’s main interface.
To find an app you are not tracking, use the search bar to the right to search for it by name or Track ID.

You can locate your app’s Track ID in its URL, preceded by “ID” as follows (underlined in red):

After you have located your app, click on the search result to view it. Once you’re viewing it, click on the green plus sign beside its name to add it to your Watched Apps.
Watched Apps are indicated by a gray check mark beside the app’s name. To remove an app from your watch list, click on the check mark, and follow the on-screen prompt to confirm that you want to remove it.
In order to toggle between apps on your Watchlist, simply click the drop down arrow on the top left and select from your list.

You may also add up to five competitors. To do this, click on an empty competitor slot in the header, and search for the app by name and click on the correct search result.

You will be able to manage your Watched Apps list, as well as add and remove competitors, from any screen within the app. To remove a competitor, click on the X next to its name.
Please note that if your app is available for both Apple and Android, you will need to track each version separately.
Mobile App Insights Metrics
If you have other questions about the App Center or the Mobile App Insights app, please email us directly at [email protected].